Recently while working on a code uplift project with a customer, I wanted a simple way to analyse our Advanced Security results. While the Github UI provides easy methods to do basic analysis and prioritisation, we wanted to complete our reporting and detailed planning off platform. This post will cover the basic steps we followed to export GitHub Advanced Security results to a readable format!
Available Advanced Security API Endpoints
GitHub provides a few API endpoints for Code Scanning which are important for this process, with the following used today:
This post will use PowerShell as our primary export tool, but reading the GitHub documentation carefully should get you going in your language or tool of choice!
Required Authorisation
As a rule, all GitHub API calls should be authenticated. While you can implement a GitHub application for this process, the easiest way is to use an authorised Personal Access Token (PAT) for each API call.
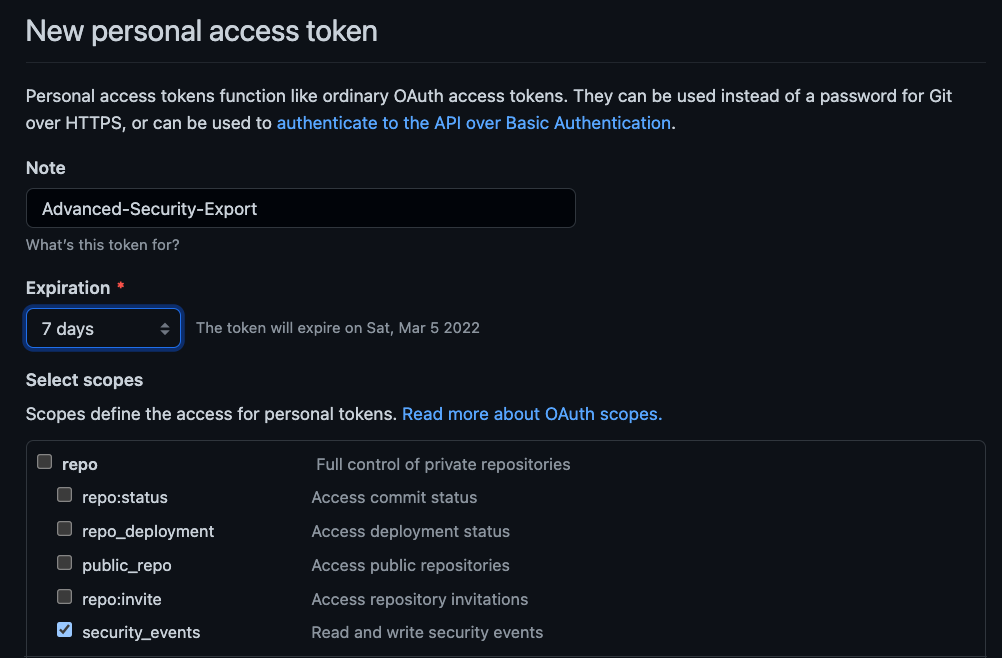
To do create a PAT, navigate to your account settings, and then to Developer Settings and Personal Access Tokens. Exporting Advanced Security results requires the security_events scope, shown below.
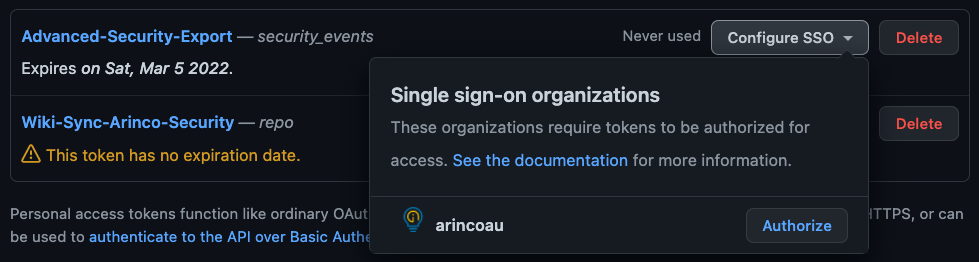
Note: Organisations which enforce SSO will require a secondary step where you log into your identity provider, like so:
Exporting Advanced Security results for a single repository
Once we have an appropriately configured auth header, calling the API to retreive results is really simple! Set your values for API endpoint, organisation and repo and you’re ready to go!
The above code is pretty straight forward, with the URL being built by providing the “owner” and repo name. One thing we found a little unclear in the doco was who the owner is. For a personal public repo this is obvious, but for our Github EMU deployment we had to set this as the organisation instead of the creating user. Once we have a URI, we call the API endpoint with our auth headers for a standard REST response. Finally, we parse the result to a nicer object format (due to the way Invoke-RestMethod -FollowRelLinkparameter works).
The outcome we quickly achieve using the above is a PowerShell object which can be exported to parsable JSON or CSV formats!
Once you have a PowerShell Object, this can be exported to a tool of your choice
Exporting Advanced Security results for an entire organisation
Recently Arinco has made an internal move to GitHub Enterprise for some of our code storage. For the most part, this has been a seamless process. All of our code is agnostic, and we support customers using both Azure DevOps and GitHub already. While supporting this move, some consideration was made for how best to manage documentation – We’ve found the Azure DevOps wiki feature to be extremely useful. It provides a suitable UI for business users to modify documentation, while also enabling developer friendly markdown. Github provides a similar capability using its own wiki feature.
On investigating the process for wiki usage within GitHub, we noticed an interesting difference to Azure DevOps – GitHub stores wiki files in a separate repo. This can be quickly seen when you navigate to the wiki tab and are presented with a second git URL to clone.
Another repo to manage? No thanks.
Now while this works in the same manner as Azure DevOps for developer/business scenarios, managing two repositories is annoying. Git does support adding the wiki as a submodule, however developers are required to complete a double commit and to some, the submodule UI on GitHub is a bit clunky.
To solve this challenge, we turned to the community, specifically looking for a pre-canned GitHub Action. Thankfully this isn’t a new complaint from the community and SwiftDoc had already created an action. After setting up a PAT and running couple of tests with this, we found some behaviour annoying on the developer side. Specifically that files are not deleted, only created and directory structure is not preserved. And so, we have a slightly modified action:
This action doesn’t really cater as well for the business/developer split (files created in the GUI will be deleted), but for us, this works just fine and isn’t annoying. Until next time, stay cloudy!
One of the many things I love about the cloud is the ease at which it allows me to develop and deploy solutions. I recently got married – An event which is both immensely fulfilling and incredibly stressful to organise. Being a digital first millennial couple, my partner and I wanted to deliver our invites electronically. Being the stubborn technologist that I am, I used the wedding as an excuse to practice my cloud & python skills! This blog neatly summarises what I implemented, and the fun I dealt with along the way.
The Plan – How do I want to do this?
For me, the main goal moving was to deliver a simple, easy to use solution which enabled me to keep sharp on some cloud technology, time and complexity was not a deciding factor. Being a consultant, I generally touch a multitude of different services/providers and I need to keep challenged to stay up to date on a broad range of things.
For my partner, it was important that I could quickly deliver a website, at low cost, with personalised access codes and email capability – A fully fledged mobile app would have been the nirvana, but I’m not that great at writing code (yet) – Sorry hun, maybe at a future vow renewal?
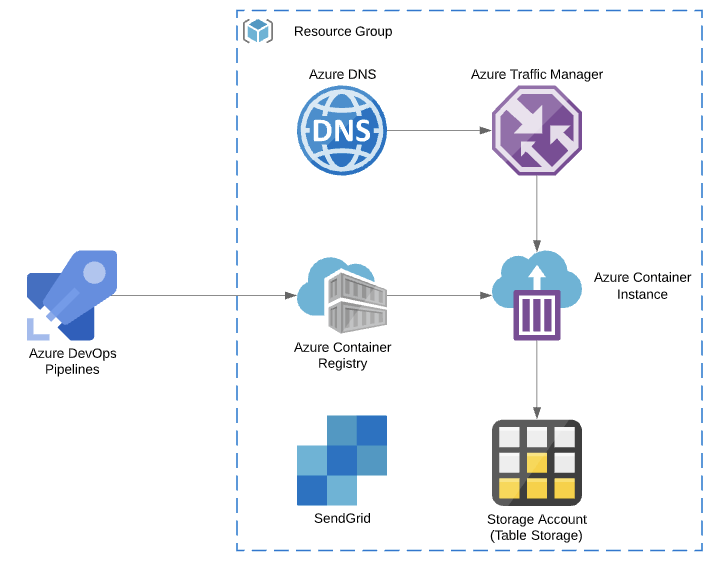
When originally planning, I really wanted to design a full end to end solution using functions & all the cool serverless features. I quickly realised that this would also take me too long to keep my partner happy, so I opted for a simpler path – an ACI deployment, with Azure Traffic manager allowing a nice custom domain (Feature request please MS). I designed Azure Storage as a simple table backend, and utilised SendGrid as the email service. Azure DNS allowed me to host all the relevant records, and I built my containers for ACR Using Azure DevOps.
Slapping together wedding invites on Azure in an afternoon? Why not?
Implementing – How to use this flask thing?
Ask anyone who knows me and they will tell you I will give just about anything a crack. I generally use python when required for scripting/automation and I really don’t use it for much beyond that. When investigating how to build a modern web app, I really liked the idea of learning some more python – It’s such a versatile language and really deserves more of my attention. I also looked at using React, WordPress & Django. However I really hate writing javascript, this blog is WordPress so no learning there, and Django was have been my next choice after flask.
Implementing into flask was actually extremely simple for basic operations. I’m certain I could have implemented my routing in a neater manner – perhaps a task for future refactoring/pull requests! I really liked the ability to test flask apps by simply running python3 app.py. A lot quicker than a full docker build process, and super useful in development mode!
The template based model that flask enables developers to utilise is extremely quick. Bootstrap concepts haven’t really changed since it was released in 2011, and modifying a single template to cater for different users was really simple.
For user access, I used a simple model where a code was utilised to access the details page, and this code was then passed through all the web requests from then on. Any code submitted that did not exist in azure storage simply fired a small error!
The end result of my bootstrap & flask configuration was really quite simple – my Fiance was quite impressed!
Deployment – Azure DevOps, ACI, ARM & Traffic Manager
Deploying to Azure Container Registry and Instances is almost 100% idiotproof within Azure DevOps. Within about five minutes in the GUI, you can get a working pipeline with a docker build & push to your Azure Container Registry, and then refresh your Azure Container Instances from there. Microsoft doesn’t really recommend using ACI for anything beyond a simple workloads, and I found support for nearly everything to be pretty limited. Because I didn’t want a fully fledged AKS cluster/host or an App Service Plan running containers, I used traffic manager to work around the custom domain limitations of ACI. As a whole, the traffic manager profile would cost me next to nothing, and I knew that I wouldn’t be receiving many queries to the services.
At some point I looked at deploying my storage account using ARM templates, however I found that table storage is currently not supported for deployment using this method. You will notice that my azure pipeline uses the Azure Shell commands to do this. I didn’t get around to automating the integration from storage to container instances – Mostly because I had asked my partner to fill out another storage account table manually and didn’t want to move anything!
For my outbound email I opted to utilise SendGrid. You can actually sign up for this service within the Azure Portal as a “third party service”. It adds an object to your resource group, however administration is still within the SendGrid portal.
Issues?
As an overall service, I found my deployment to be relatively stable. I ran two issues through my deployment, both of which were not too simple to resolve.
1. Azure Credit & Azure DNS – About halfway through the live period after sending my invites, I noticed that my service was down. This was actually due to DNS not servicing requests due to insufficient credit. A SQL server I was also labbing had killed my funds! This was actually super frustrating to fix as I had another unrelated issue with the Owner RBAC on my subscription – My subscription was locked for IAM editing due to insufficient funds, and I couldn’t add another payment method because I was not owner – Do you see the loop too? I would love to see some form of payment model that allows for upfront payment of DNS queries in blocks or chunks – Hopefully this would prevent full scale DNS based outages when using Azure DNS and Credit based payment in the future.
2. SPAM – I also had a couple of reports of emails sent from sendgrid being marked as spam. This was really frustrating, however not common enough for me to dig into as a whole, especially considering I was operating in the free tier. I added a DKIM & DMARC Record for my second run of emails and didn’t receive as much feedback which was good.
The Cost – Was it worth it?
All in All the solution I implemented was pretty expensive when compared to other online products and even other Azure services. I could have definitely saved money by using App Services, Azure Functions or even static Azure Storage websites. Thankfully, the goal for me wasn’t to be cheap. It was practice. Even better though, my employer provides me with an Azure Credit for dev/test, so I actually spent nothing! As such, I really think this exercise was 100% worth it.
Summary – Totally learnt some things here!
I really hoped you enjoyed this small writeup on my experience deploying small websites in Azure. I spent a grand total of about three hours over two weeks tinkering on this project, and you can see a mostly sanitised repo here. I definitely appreciated the opportunity to get a little bit better at python, and will likely look to revisit the topic again in the future!
(Heres a snippet of the big day – I’m most definitely punching above my average! 😂)
In one of my favourite movies Gerard Butler utters the line “lessons not learned in blood are soon forgotten”. That is certainly how I felt last week while attempting to regain access to my cloud accounts. Ok, Ok – Maybe a movie about a jail-bound revenge obsessed serial killer isn’t the best analogy for a nerd playing god in a cloud lab.
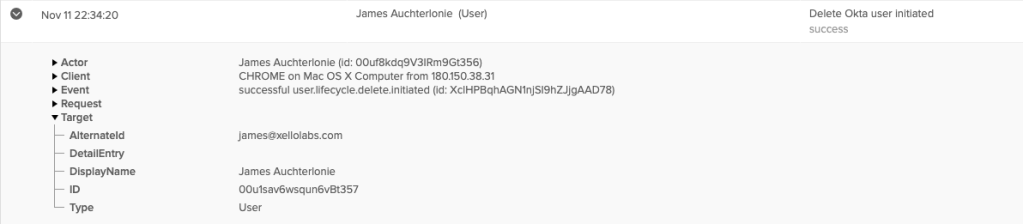
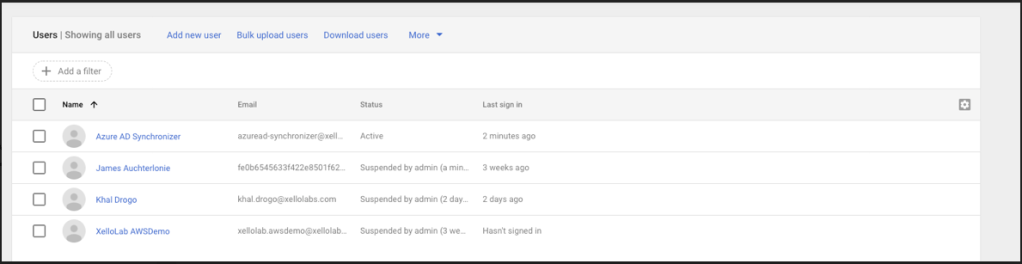
Whenever playing with a cloud service that manages provisioning & activations for your cloud users, it’s important to be alert and understand what actions you are taking. How was I reminded of this? I broke my own setup! While deleting a bunch of users in a fit of rage at an inconvenient Lab setup last week, I was neither alert, nor understanding. Have a look at the below screenshots and have a guess at what happened.
The importance of this account? It was my Google Cloud Super admin.
Here is the part where you say – It’s alright James, use your emergency account. Your rainy day account. The forgot my password account. The one you keep spare for when you get hit by a bus.
Bummer for me – I didn’t configure one.
Ok, fair enough, There’s an account recovery process right? The problem? Account recovery doesn’t work for a disabled account.
Next. Maybe I can re-enable the account using Okta? Remember that fit of rage I was talking about? I also deleted the Okta Application.
Yep. I’m a bonehead.
Ok, next option? Google support. Surely they should be able to help me!
Case: #21249639
Subject: Okta Deleted/Disabled my organisation Super Administrator

Evening Google,

I was testing some Okta configuration for google cloud configuration late at night. Unfortunately I deleted an okta account that matched the GCP account, and it disabled/deleted the corresponding account: james@xellolabs.com which is the super administrator for my GCP test organisation. I am no longer able to log into the google cloud console or admin.google.com to configure IAM or any extra users.

I can provide proof of ownership for the DNS zone xellolabs.com

I can also provide information as to how the organisation is configured, likely how it is billed (Can't remember the exact credit card)

Apologies for this boneheaded error, I will setup an emergency account in future.

Cheers,

James
You can see where this is going right? Google Response 1 (Paraphrased for length)
Dear James,
That certainly is boneheaded of you. Please refer to our support article here for admin password reset. https://support.google.com/a/answer/33561?hl=en

Thanks

Google Support.
No thank-you google – I need some actual help here.
Morning Google,

Unfortunately this does not solve my problem. As I mentioned in the original ticket, Okta has disabled the Super Administrator for my google organisation. I cannot log in to admin.google.com to create new accounts or modify users. I can also not recover the account as it is disabled.

When I log into the google console, I receive the following username:

fe0b6545633f422e8501f62c8d3ca20aJames@xellolabs.com

I believe it should be just james@xellolabs.com

If you could assist with activating the account I can log in, as I definitely have working credentials

Cheers,

James
Google Response 2 (Paraphrased for length)
Dear James,

I understand you have a problem. It looks like you are having an account ownership dispute. Unfortunately google cannot adjudicate these disputes, please reach out to the  super admin for access. Should you like, I can contact the super admin and ask them to contact you.
If none of this works, we can completely delete your organisation and you build your lab again.

Thanks,

Google Support.
FFS Guys! It’s me! I swear! At this point I requested that google contact my super admin. After all, this lab had a population of 3. Me, Myself and I. Surely they would flick a message to one of my many emails?
Outlook? Gmail? Work? Hotmail? Custom Email?
Zilch. Nada. Nothing. All in all a frustrating experience with Google support. Not something I would recommend on the best of days.
Finally I realised that I had configured a service account for Azure-> GCP integration. I had credentials for this thankfully. I could check who was in my google org & who I was supposed to be contacting!
One quick login to admin.google.com:
Even better news? This was the account I needed! In a past life I had been a lazy bastard and not configured the minimum RBAC!
Account Recovered!
Ok so what did we learn today?
Configure a break glass account. Store it offline & test it regularly.
Don’t rely on support to recover your account. Contextual information like a service account names will be overlooked & you may get the runaround.
Don’t add your break glass accounts to automated deprovisioning flows. You are asking for trouble.
Document the level of access you grant to service accounts. You never know when this information might come in handy!
Have a tested BCDR strategy, using off cloud backup or IaC to restore.
Most importantly, I learnt my lesson in blood. Don’t be a bonehead and hopefully you won’t run into this problem yourself!
In this blog, we continue where we left off in part one, spending a bit more time expanding on the capabilities of Azure Monitor. Specifically, how powerful Log Analytics & KQL can be, saving us huge amounts of time and preventing alert fatigue. If you haven’t already decided whether or not to use SCOM or Azure monitor, head over to the Xello comparison article here.
For now, lets dive in!
Kusto Query Language (KQL) – Not your average query tool.
Easily the biggest change that Microsoft recommends when moving from SCOM to Azure Monitor is to change your alerting mindset. Often organisations get bogged down in resolving meaningless alerts – Azure Monitor enables administrators to query data on the fly, acting on what they know to be bad, rather than what is defined in a SCOM Management Pack. To provide these fast queries, Microsoft developed Kusto Query Language – a big data analytics cloud service optimised for interactive ad-hoc queries over structured, semi-structured, and unstructured data. Getting started is pretty simple and Microsoft have provided cheat-sheets for those of you familiar with SQL or Splunk queries.
What logs do I have?
By default, Azure Monitor will collect and store platform performance data for 30 days. This might be adequate for simple analysis of your virtual machines, but ongoing investigations and detailed monitoring will quickly fall over with this constraint. Enabling extra monitoring is quite simple. Navigate to your work space, select advanced settings, and then data.
From here, you can on board extra performance metrics, event logs and custom logs as required. I’ve already completed this task, electing to on board some Service, Authentication, System & Application events as well as guest level performance counters. While you get platform metrics for performance by default, on-boarding metrics from the guest can be an invaluable tool – Comparing the two can indicate where systems are failing & if you have an underlying platform issue!
Initially, I just want to see what servers I’ve on-boarded so here we run our first KQL Query:
Heartbeat | summarize count() by Computer
A really quick query and an even quicker response! I can instantly see I have two servers connected to my work space, with a count of heartbeats. If I found no heartbeats, something has gone wrong in my on-boarding process and we should investigate the monitoring agent health.
Show me something useful!
While a heartbeat is a good indicator of a machine being online, it doesn’t really show me any useful data. Perhaps I have a CPU performance issue to investigate. How do I query for that?
Perf | where Computer == “svdcprod01.corp.contoso.com” and ObjectName == “Processor” and TimeGenerated > ago(12h) | summarize avg(CounterValue) by bin(TimeGenerated, 1minutes) | render timechart
Looks like a bit, but in reality this query is quite simple. First, I select my Performance data. Next I filter this down. I want data from my domain controller, specifically CPU performance events from the last 12 hours. Once I have my events, I request a 1 minutes summary of the CPU value and push that into a nice time chart! The result?
Using this graph, you can pretty quickly identify two periods when my CPU has spiked beyond a “normal level”. On the left, I spike twice above 40%. On the right, I have a huge spoke to over 90%. Here is where Microsoft’s new monitoring advice really comes into effect – Monitor what you know, when you need it. As this is a lab domain controller, I know it turns on at 8 am every morning. Note there is no data in the graph prior to this time? I also know that I’ve installed AD Connect & the Okta agent – The CPU increases twice an hour as each data sync occurs. With this context, I can quickly pick that the 90% CPU spike is of concern. I haven’t setup an alert for performance yet, and I don’t have to. I can investigate when and if I have an issue & trace this back with data! My next question is – What started this problem?
If you inspect the usage on the graph, you can quickly ascertain that the major spike started around 11:15 – As the historical data indicates this is something new, it’s not a bad assumption that this is something new happening on the server. Because I have configured auditing on my server and elected to ingest these logs, I can run the following query:
SecurityEvent | where EventID == “4688” and TimeGenerated between(datetime(“2019-07-14 1:15:00”) .. datetime(“2019-07-14 1:25:00”))
This quickly returns me out a manageable 75 records. Should I wish, I could probably manually look through this and find my problem. But where is the fun in that? A quick scan reveals that our friend xelloadmin appears to be logged into the server during the specified time frame. Updated Query?
SecurityEvent | where EventID == “4688” and Account contains “xelloadmin” and TimeGenerated between(datetime(“2019-07-14 1:15:00”) .. datetime(“2019-07-14 1:25:00”))
By following a “filter again” approach you can quickly bring large 10,000 row data sets to a manageable number. This is also great for security response, as ingesting a the correct events will allow you to reconstruct exactly what has happened on a server without even logging in! Thanks to my intelligent filtering, I’m now able to zero in on what appears to be a root cause. It appears that xelloadmin launched two cmd.exe processes less than a second apart, exactly prior to the CPU spike. Time to log in and check!
Sure enough, these look like the culprits! Terminating both process has resulted in the following graph!
Let’s create alerts and dashboards!
I’m sure you’re thinking at this point, that everything I’ve detailed out is after the fact – More importantly, I had to actively look for this data. You’re not wrong to be concerned about this. Again, this is the big change in mindset that Microsoft is pushing with Azure Monitor – Less alerting is better. Your applications are fault tolerant, loosely coupled and scale to meet demand already right?
If you need an alert, make sure it matters first. Thankfully, configuration is extremely simple should you require one! First, work out your alert criteria- What defines that something has gone wrong? In my case, I would like to know when the CPU has spiked to over a threshold. We can then have a look in the top right of our query window- You should notice a “new alert rule” icon. Clicking this will give you a screen like the following:
The condition is where the magic happens – Microsoft has been gracious enough to provide some pre-canned conditions, and you can write your own KQL should you desire. For the purpose of this blog, we’re going to use a Microsoft rule.
As you can see, this rule is configured to trigger when CPU hits 50% – Our earlier spike thanks to the careless admin would definitely be picked up by this! Once I’m happy with my alert rule, I can configure my actions – Here is where you can integrate to existing tools like ServiceNow, JIRA or send SMS/Email alerts. For my purposes, I’m going to setup email alerts. Finally, I configure some details about my alert and click save!
Next time my CPU spikes, I will get an email from Microsoft to my specified address and I can begin investigating in almost realtime!
The final, best and easiest way for administrators to get quick insights into their infrastructure is by building a dashboard. This process is extremely simple – Work out your metrics, write your queries and pin the results.
You will be prompted to select your desired dashboard – If you haven’t already created one, you can deploy a new one within your desired resource group! With a properly configured workspace and the right queries, you could easily build a dashboard like the one shown below. For those of you who have Azure Policy in place, please note that custom dashboards deploy to the Central US region by default, and you will need to allow an exception to your policy to create them.
Final Thoughts
If you’ve stuck with me for this entire blog post, thank you! Hopefully by now you’re well aware of the benefits of Azure monitor over System Center Operations Manager. If you missed our other blogs, head on over to Part One or our earlier comparison article! As Always, please feel free to reach out should you have any questions, and stay tuned for my next blog post where I look at replacing System Center Orchestrator with cloud native services!
As more organisations continue their evolving cloud journey in 2019, many will begin to learn the concept and benefits of “infrastructure as code”, or IaC for short.
IaC is a method to define, build and deploy vast environments within a few minutes. IaC files are easily readable, extremely portable and often serve as a documentation tool for IT administrators. Each cloud platform provides a separate IaC tool: Azure uses ARM templates, AWS uses CloudFormation and Google Cloud uses Deployment Manager.
Infrastructure as Code effectively manages your business environment through machine-readable scripts or definition files, rather than through manual processes. IaC models uses code and automation to deliver the desired state of environment consistently and securely at scale, eliminating traditional security risks from human error.
So, why should you care about IaC? For starters, Infrastructure as code tools have multiple advantages for almost all cloud management and IT efforts:
Deployment becomes repeatable and consistent, making it easier to redeploy your cloud environment in any scenario
IaC is self documenting, meaning if you can read a template, you can understand what should be in your cloud environment
Faster deployment timelines as engineers can share templates for specific resources, saving huge amounts of build time
You can delete resources with confidence and bring them back the moment they are needed
You can version control your environment, using a source control service like Git which enables you to rollback to an older environment fast
While all three IaC tools for each cloud platform have similarities and huge advantages, each product is specific to a respective platform. You can’t deploy a CloudFormation template to Azure and you need to know the differences between the two to convert them. For many admins, understanding multiple languages is time consuming.
Thankfully, there is a new solution which simplifies this process and makes unlocking IaC’s benefits more accessible.
What is Terraform?
To solve IT administrators nightmares, Hashicorp has been kind enough to develop Terraform – a multi-cloud, multi-platform IaC tool.
In a similar manner to the other IaC tools, Terraform uses configuration files to define, deploy and destroy cloud infrastructure. To make the product even more juicy for admins, Terraform supports multiple cloud and on premise services. Your IaC files can easily be converted for on premise deployment and expanded to support different platforms – AWS, Google Cloud, Microsoft Azure, and more.
Terraform files are written using Hashicorp Configuration Language (HCL). You might have just groaned at the thought of learning a new language, but you don’t need to stress – it’s pretty similar YAML markdown. Terraform files can be broken down into three main components; Providers, Variables and Resources.
Providers are utilised to detail what environment types you need (eg AWS/Azure/GCP)
Variables are used to set a value once and use it throughout a file
Resources are what will be deployed into your environments
Once a Terraform file is deployed, a state file is created detailing the current configuration and you can provide a tfvar variable file for variable input into a template.
How to I setup Terraform?
One of my favourite features of Terraform is the ease with which you can get started.
Simply download the product and then add the binary to your environment path. If you want to test it out first, download the files and open a command prompt at the download location. Once ready to go, type Terraform in your command line to test.
There is a fair few options shown above and available to run with Terraform – we will only cover a few in this blog.
Writing Terraform Files?
Now that we have setup Terraform for use its time to write some code.
First, declare the provider you require – We’re going to start with AWS, and use this public cloud provider to deploy some networking infrastructure and an EC2 instance.
Should you need to configure a new AWS access and secret key you can find documentation on this process here. You can probably already tell that Terraform configuration can be a lot less wordy than its platform-specific counterpart. Next, we will deploy some resources: I want a VPC, some subnets and an EC2 instance.
You should notice each resource does have a list of available options and this changes depending on what you’re deploying.
I normally keep the Terraform providers reference open when writing files, as it’s a helpful tool to check what settings are available.
If you’re interested in seeing the similarity between Azure & AWS deployment on Terraform, I’ve published some example templates to Github.
Checking your deployment code & Terraform state
Once you have completed your Terraform code, you can complete a test of the files using Terraform plan.
This command will allow you to see in advance what actions Terraform will take.
There is a fair bit of output produced, so I’ve removed some from the provided screenshots just to show the functionality at a high level.
<Redacted for brevity>
Whenever discussing Terraform deployments or plans, its extremely important to understand Terraform state. This is a reference file for anything you have deployed using Terraform. If you begin to work on a Terraform project, all your plans and deployment actions will be influenced by this data. State can be a tricky thing to manage when working in teams, requiring storage in a central location.
If you have a look at the following plan, you will notice that there is no changes to be deployed. This is because my current state file matches the resources I’ve deployed within AWS. I personally find this extremely useful when writing Terraform files, as I can test as often as I like and only see the changes that I’m actually writing in my files
Making your changes
Now that you have validated your files using Terraform plan, it’s time to deploy. Again, this is super simple:
Terraform apply
You should get an up to date plan with the changes to be applied and be prompted to confirm your actions.
<Redacted for brevity>
<Redacted for brevity>
A quick look at my AWS dashboard confirms a newly created EC2 instance!
Introduction to Terraform: Next steps
Hopefully you now have a high level understanding of how Terraform works and how you can use it within your environment. If you’re interested in seeing the similarity between Azure & AWS deployment on Terraform, I’ve published some example templates to Github. There is a couple of simple files using the providers for AWS, Azure and a combined file to demonstrate ways to deploy across cloud. Like all good engineers, my secrets have been stripped out & you will need to reference the documentation for setting up your own environment.