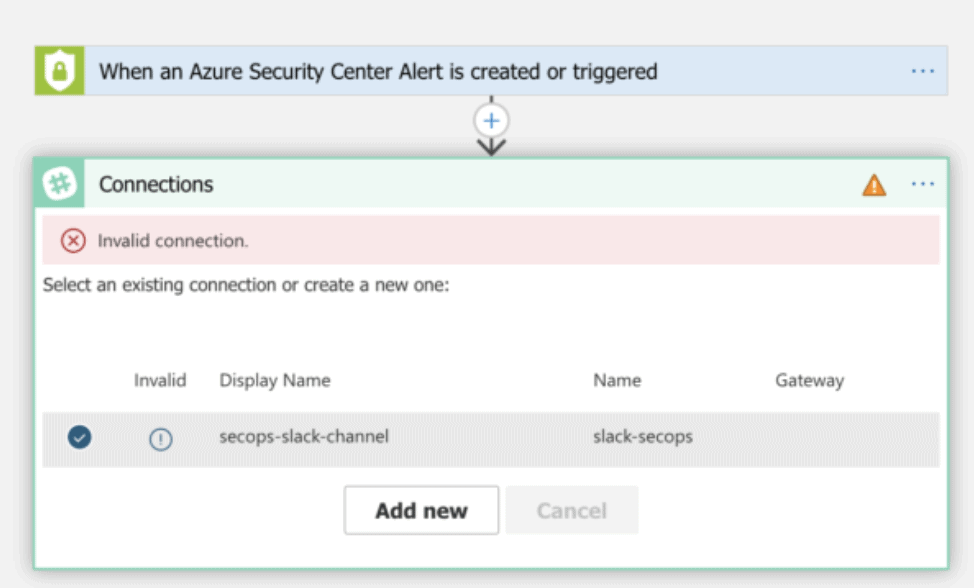
Recently I’ve been working on some automated workflows for Azure Security Center and Azure Sentinel. Following best practice, after initial development, all our Logic Apps and connectors are deployed using infrastructure as code and Azure DevOps. This allows us to deploy multiple instances across customer tenants at scale. Unfortunately, there is a manual step required when deploying some Logic Apps, and you will encounter this on the first run of your workflow.
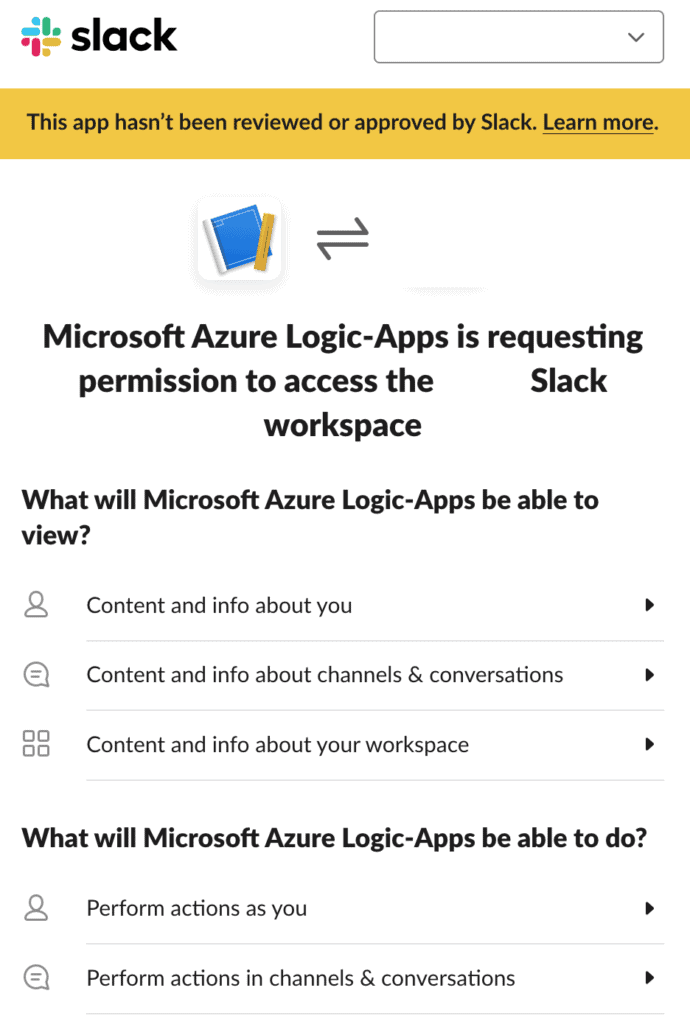
This issue occurs because connector resources often utilise OAuth flows to allow access to the target services. We’re using Slack as an example, but this includes services such as Office 365, Salesforce and GitHub. Selecting the information prompt under the deployed connector display name will quickly open a login screen, with the process authorising Azure to access your service.
Microsoft provides a few options to solve this problem;
Manually apply the settings on deployment. Azure will handle token refresh, so this is a one time task. While this would work, it isn’t great. At Arinco, we try to avoid manual tasks wherever possible
Pre-deploy connectors in advance. As multiple Logic Apps can utilise the same connector, operate them as a shared resource, perhaps owned by a platform engineering group.
Operate a worker service account, with a browser holding logged-in sessions. Use DevOps tasks to interact and authorise the connection. This is the worst of the three solutions and prone to breakage.
A better way to solve this problem would be to sidestep it entirely. Enter app webhooks for Slack. Webhooks act as a simple method to send data between applications. These can be unauthenticated and are often unique to an application instance.
To get started with this method, navigate to the applications page at api.slack.com, create a basic application, providing an application name and a “development” workspace.
Next, enable incoming webhooks and select your channel.
Just like that, you can send messages to a channel without an OAuth connector. Grab the CURL that is provided by Slack and try it out.
Once you have completed the basic setup in Slack, the hard part is all done! To use this capability in a Logic App, add the HTTP task and fill out the details like so:O
You will notice here that the request body we are using is a JSON formatted object. Follow the Slack block kit and you can develop some really nice looking messages. Slack even provides an excellent builder service.
Block kit enables you to develop rich UI within Slack.
Completing our integration in this manner has a couple of really nice benefits – Avoiding the manual work almost always pays off.
No Manual Integration, Hooray!
Our branding is better. Using the native connector does not allow you to easily change the user interface, with messages showing as sent by “Microsoft Azure Logic Apps”
Integration to the Slack ecosystem for further workflows. I haven’t touched on this here, but if you wanted to build automatic actions back to Logic Apps, using a Slack App provides a really elegant path to do this.
In medicine there is a saying “an ounce of prevention is worth a pound of cure”” – What this concept boils down to for health practitioners is that engaging early is often the cheapest & simplest method for preventing expensive & risky health scenarios. It’s a lot cheaper & easier to teach school children about healthy foods & exercise than to complete a heart bypass operation once someone has neglected their health. Importantly, this concept extends to multiple fields, with CyberSecurity being no different. Since the beginning of cloud, organisations everywhere have seen explosive growth in infrastructure provisioned into Azure, AWS and GCP. This explosive growth all too often corresponds with increases to security workload without required budgetary & operational capability increases. In the quest to increase security efficiency and reduce workload, this is a critical challenge. Once a security issue hits your CSPM, Azure Security Centre or AWS Trusted Inspector dashboard, it’s often too late; The security team now has to work to complete within a production environment. Infrastructure as Code security testing is a simple addition to any pipeline which will reduce the security group workload!
Preventing this type of incident is exactly why we should complete BASIC security testing..
We’ve already covered quality testing within a previous post, so today we are going to focus on the security specific options.
The first integrated option for ARM templates is easily the Azure Secure DevOps kit (AzSK for short). The AzSK has been around for while and is published by the Microsoft Core Services and Engineering division; It provides governance, security IntelliSense & ARM template validation capability, for free. Integrating to your DevOps Pipelines is relatively simple, with pre-built connectors available for Azure DevOps and a PowerShell module for local users to test with.
Another great option for security testing is Checkov from bridgecrew. I really like this tool because it provides over 400 tests spanning AWS, GCP, Azure and Kubernetes. The biggest drawback I have found is the export configuration – Checkov exports JUnit test results, however if nothing is applicable for a specified template, no tests will be displayed. This isn’t a huge deal, but can be annoying if you prefer to see consistent tests across all infrastructure…
The following snippet is all you really need if you want to import Checkov into an Azure DevOps pipeline & start publishing results!
Depending on your background, breaking the build can really seem like a negative thing. After all, you want to prevent these issues getting into production, but you don’t want to be a jerk. My position on this is that security practitioners should NOT break the build for cloud infrastructure testing within dev, test and staging. (I can already hear the people who work in regulated environments squirming at this – but trust me, you CAN do this). While integration of tools like this is definitely an easy way to prevent vulnerabilities or misconfigurations from reaching these environments, the goal is to raise awareness & not increase negative perceptions.
Security should never be the first team to say no in pre-prod environments.
Use the results of any tools added into a pipeline as a chance to really evangelize security within your business. Yelling something like “Exposing your AKS Cluster publicly is not allowed” is all well and good, but explaining why public clusters increase organisational risk is a much better strategy. The challenge when security becomes a blocker is that security will no longer be engaged. Who wants to deal with the guy who always says no? An engaged security team has so much more opportunity to educate, influence and effect positive security change.
Don’t be this guy.
Importantly, engaging well within dev/test/sit and not being that jerk who says no, grants you a magical superpower – When you do say no, people listen. When warranted, go ahead and break the build – That CVSS 10.0 vulnerability definitely isn’t making it into prod. Even better, that vuln doesn’t make it to prod WITH support of your development & operational groups!
Hopefully this post has given you some food for thought on security testing, until next time, stay cloudy!
Note: Forest Brazael really has become my favourite tech related comic dude. Check his stuff out here & here.
One of the many benefits of partnering with Microsoft is that occasionally Xello gets to see, explore and put to the test upcoming products and services ahead of time.
With Azure Bastion finally being announced and released to public preview, we’ve had Bastion for a while and are keen to share our impressions of its capabilities.
In short, for remote VM access directly in your web browser and private virtual machine access, it’s awesome and well worth looking into.
Today’s blog post from our senior consultant James Auchterlonie will explain what Azure Bastion is, why you should use it, and how to deploy the service in your business.
What is Azure Bastion?
Azure Bastion is designed to allow administrative access to a virtual machine without leaving the browser.
In Microsoft high level architecture for protected services, you can see an IaaS Bastion Host in the bottom left corner. While these hosts do increase security, they come with a few drawbacks; you need to maintain and harden them against vulnerabilities, and you need to pay extra to run them as they can possibly introduce more vulnerabilities.
Azure Bastion removes the need for this IaaS Virtual machine, simonizing your network footprint, maintenance overhead and allows you to get on with your day-to-day ops.
Why should I use Bastion hosts?
If you haven’t already guessed, Azure Bastion increase security in a number of different ways.
Logging: Who accessed what, when and what did they do?
Protecting your application against (some) port scanning.
Harden a single external endpoint.
Prevent rogue SSH/RDP access by adding an additional layer.
Slow down attackers.
Some key advantages that Microsoft touts in their official documentation for Azure Bastion include:
RDP directly in Azure Portal.
SSH directly in Azure Portal.
Remote Session over HTML5 (HTTPS/443).
No Public IP required on the Azure VM.
No hassle of managing NSGs.
No Firewall Traversal for RDP/SSH.
How do I turn Azure Bastion on?
Azure Bastion is extremely easy to activate, provided you have the appropriate network size.
First, you need to assign a complete subnet to the service, ensuring that it is larger than a /27 address space. The subnet must also match the name “AzureBastionSubnet’.
Next, search for the Azure Bastion service within the Azure Portal.
Select Create Azure Bastion, and fill out the required details.
From here, select Review + Create, and just like that – you have a enabled Azure Bastion for your network.
How do I connect to Azure Bastion for remote VM access?
Once you have enabled Azure Bastion, you can use the existing connection pane within the Azure portal to connect into your virtual machines.
You should now notice an extra “Azure Bastion” section under the connection pop-up.
If successful, you should have a new tab opened within your Web browser of choice.
Azure Bastion: Early Thoughts and Minor Drawbacks
While I write this post, Azure Bastion is in public preview.
If I click publish, someone somewhere at Microsoft would be quite upset with me. There are a couple of caveats that you currently need to be aware of when using it.
Azure Bastion currently doesn’t support Hub + Spoke vnet deployments. You will need to add a Bastion subnet for each vnet that you intend to use.
Azure Bastion is HTML 5 and it does lack a couple of features you might be used to within RDP; I found copy/paste to be a bit flaky.
You currently cannot use Azure AD Sign in.
There isn’t currently a way to view who is using a Bastion session in the portal – you can use the event logs on each host if you’re desperate to get this information.
That being said, this is easily one of my favourite ‘little releases’ of 2019 and I hope I can release this post as soon as possible.
The reason for this is the level of separation it provides for administrative hosts within Microsoft Azure.
Combine this solution with Just in Time network access, and you can easily avoid using any internet facing hosts – all with platform native tools. Another big win for Microsoft.
Liked this post? Feel free to reach out to the Xello team for more hands-on guidance on how Azure Bastions can fit your setup. Keep this page bookmarked as we update it with the latest capabilities as Azure Bastion continues to evolve past its public preview stage.
After setting up Windows Virtual Desktop last week, I thought I would continue the preview theme of my blog. Prior to RSA San Francisco, Microsoft announced Azure Sentinel: A cloud first Security information and event management (SIEM) tool built on top of Azure Log Analytics, Logic Apps & Jupyter notebooks.
As a huge security geek, Microsoft’s gradual push into the security space is something I will always welcome and I’m really excited to see some competition to Splunk’s IT Service Intelligence & AWS Guard duty. The intent from Microsoft is to provide super cool automated threat detection features, while also providing detailed analysis and incident response capability to security operations center (SOC) engineers!
The other side effect of using AI/ML is the reduced alert fatigue. Open any badly tuned SIEM (even some well-tuned ones) and you will quickly realise how many logs a fully operational environment generates. With new cloud services doing a bunch of heavy lifting, SOC engineers can focus on what matters: Responding and investigating.
Thankfully, deployment for Azure Sentinel is extremely simple – even faster if you’re already using Azure Security Center. Let’s get stuck in!
Azure Sentinel – What you need before you begin
Before you start you will need the following:
An active Azure Subscription
A couple of pre-configured virtual machines
An East US log analytics workspace. Sentinel is East US only while in public preview, but expect this to change as the product nears release date.
To get some useful data in quickly, I’ve already configured Azure Security Center and forced server enrolment. If you’re not using Security Center, it is the best way to get excellent insight into your Azure security standing. The added bonus is on-boarding Sentinel is much easier!
If you need to enable automatic provisioning, you can turn this on with a standard Security Center plan ($15/node). The settings are available from: Security Center > Security Policy > Subscription Settings > Data Collection.
Azure Sentinel – Step #1: Activating Sentinel
Enabling Azure Sentinel is extremely easy – almost too simple for a blog post.
Search for Sentinel in the focus bar on the top of your Azure Portal and select the option with the blue shield. This will take you to Azure Sentinel workspaces, where you can view the sentinel environments already configured.
Rather than utilising one Azure Sentinel instance for a complete subscription, Microsoft has accounted for multiple log analytics workspaces. I think this a really neat method for providing isolation boundaries for different areas of your environment.
Once you’re at this page, click the Connect Workspace button glaring at you and select your pre-configured workspace when prompted.
Azure Sentinel – Step #2: Setting up connectors
If you managed to complete the worlds easiest activation, you should be faced with the following welcome screen, and Sentinel is now active in your environment. You still need to onboard services and enable functionality, so stick with me for a bit longer.
Select ‘data connectors’ on the right-hand side and be blown away by all the available choices. For this blog, I’ll be onboarding my Azure Security Center, Security Events and Azure Activity. This should give us an initial footprint to see some functionality. In a production configuration, I would hopefully configure the first 9 options at a minimum. Obviously, this is dependent on what services you are utilising.
The Security Center enablement is quite simple. From here, select the menu clicker and enable a Sentinel connection for each subscription you have onboarded – you’re a good azure admin, so that’s all of them.
Remember when I said that using Security Centre makes Sentinel easier? As you can see here, I’ve enabled all events for Security Center and Sentinel has automatically detected this. If you haven’t used Security Center, pick the desired level of logs you want, and select ‘Ok’.
Finally, I’m going to onboard Azure Activity logs. This will give us visibility of what is happening at the platform level, and allow us to hunt for suspicious deployments, privilege escalation or undesired configuration change! Of the three services I have onboarded, this one is the most complex, requiring a grand total of 4 clicks. Quite exhausting, isn’t it?
At this point, I would recommend shutting down your computer and taking a walk to your nearest pub for a well-earned Furphy.
Sentinel takes a little bit of time to start seeing logs, and a bit longer to gain some actionable log data.
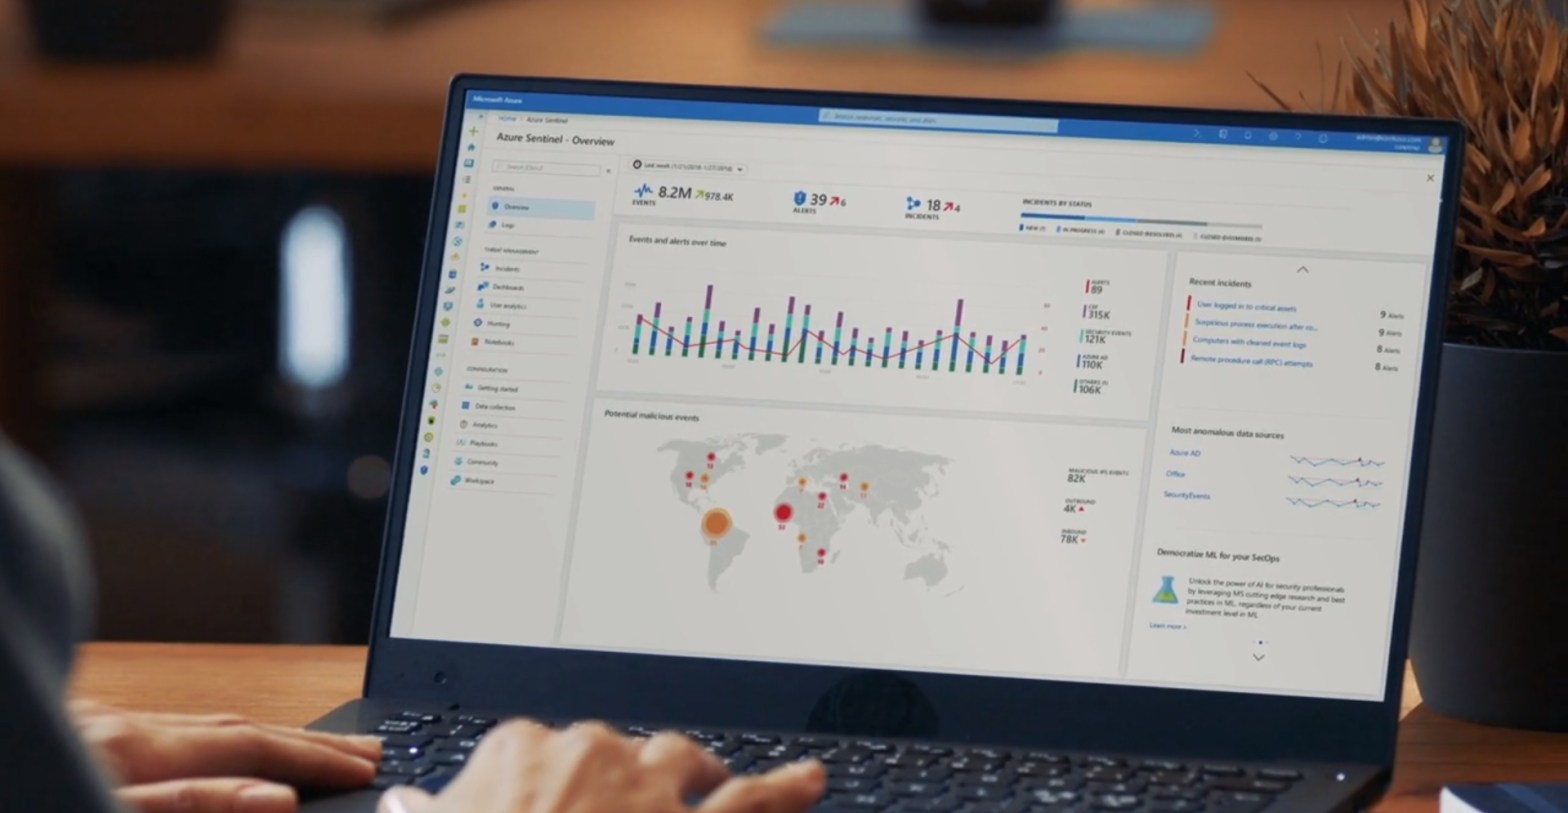
Like a well-seasoned TV chef, here’s a snapshot I created earlier.
You now have a functioning SIEM and can begin to analyse and respond to events within your environment. Congratulations!
From here, it’s time to leverage one of the largest selling points of Azure Sentinel – it’s machine learning (ML) capability, titled Fusion.
Intended to reduce alert fatigue and increase productivity, Sentinel Fusion is one of the many cloud products now utilising machine learning. Unfortunately, this isn’t enabled out of the box, and requires you to complete a couple commands to activate.
First, launch cloud shell within your portal.
Next up, update the below command with your subscription ID, resource group name and workspace details and paste it to the console.
You should receive a JSON response if the fusion activation completed successfully.
If you’re not sure and need to validate, use the following command:
At this point in my demo, I don’t actually have enough alerts and services to generate a Azure Sentinel Fusion alert, but if you want to learn more about using fusion, check out the official Microsoft blog post announcement here.
Azure Sentinel – Step #4: Threat Hunting and Playbooks
Now that we’ve configured Azure Sentinel and Fusion Machine Learning, I’m sure you’re excited to investigate threat hunting & automatic remediation (playbooks). Thankfully, both areas in Sentinel are built on top of existing, tried and tested platforms.
For Incident response, Sentinel utilises Azure Logic Apps. Anyone familiar with this product can testify to its versatility and Sentinel presents the complete list of Logic Apps for your subscription under the playbooks section.
Should you wish to create a Logic App specific to Azure Sentinel, you will now notice an extra option within the triggers section.
For hunting and investigation, Azure Sentinel provides a few great sections where SOC engineers can investigate to their hearts content.
For log analysis, Sentinel utilises the OMS workspace, built on top of KQL. Splunk engineers should find the syntax pretty easy to pick up, and Microsoft provides a cheat sheet for those making the transition.
Engineers can utilise these queries to create custom alerts under the analytics configuration section. These alerts then generate cases when a threshold is met and will soon be able to activate a pre-configured runbook (currently a placeholder is shown in the configuration section).
If you’re new to threat hunting, SANS provides some quick reference posters like this detailed Windows one and deep dives on a multitude of security topics within its reading room! The following alert rule triggers when multiple deployments occur in the specified time-frame.
.
My alert generates a case, which engineers can then investigate as demonstrated below.
In-depth investigation often requires detailed and expansive notes, and this is where the final investigation tool really shines.
The last option under threat management is Notebooks, driven by the open source Jupyter project. Clicking this menu option will take you out of the standard Azure portal and into Notebooks Azure.
If I had to pick one thing I dislike about Azure Sentinel, the separate notebooks page would be it. I really hope that this can be brought into the Azure portal at some point, but I do understand the complexity of the notebook’s functionality. Here you can view existing projects, create new ones or clone them from other people.
Covering all the functionality of Jupyter notebooks could be a blog series on its own, so head over to the open source homepage to see what it’s all about.
Azure Sentinel Impressions – The Xello Verdict
Overall, I’m really impressed with the product. While certain parts are quite clearly in preview and still require work, this is a confident first step into cloud SIEM market. If you’re evaluating early like myself, get used to seeing the following words throughout the product.
There really is a large amount of functionality in the pipeline, so Azure Sentinel only gets better from here. I’m especially excited to see the integrations with other cloud providers and have already signed up to preview the AWS guard duty integration.
If you want to dive straight into the Sentinel deep end, have a look at the GitHub page – there is a thriving community already committing a wealth of knowledge. Prebuilt notebooks, queries and playbooks should really help you adopt the product.