Managing Container Lifecycle with Azure Container Registry Tasks

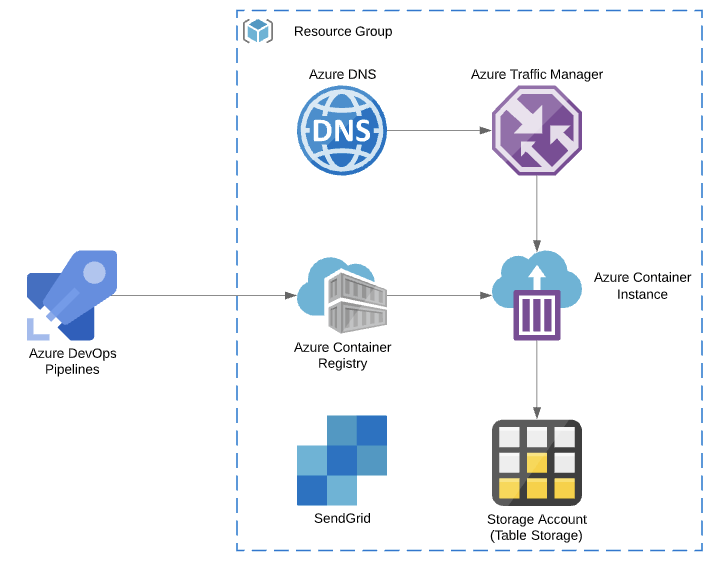
Recently I’ve been spending a bit of time working with a few customers, onboarding them to Azure Kubernetes Service. This is generally a pretty straight forward process; Build Cluster, Configure ACR, Setup CI/CD.

During the CI/CD buildout with one customer, we noticed pretty quickly that our cheap and easy basic ACR was filling up rather quickly. Mostly with development containers which were used once or twice and then never again.

Not yet 50% full in less than a month;

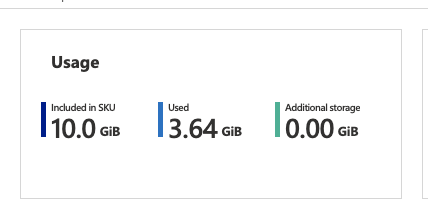
In my opinion the build rate of this repository wasn’t too bad. We pushed to development and testing 48 times over a one week period, with these incremental changes flowing through to production pretty reliably on our weekly schedule.

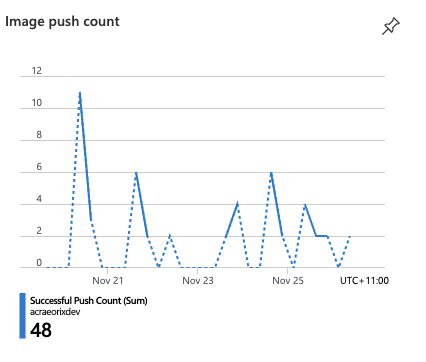
That being said, the growth trajectory put our development ACR filling up in about 3-4 months. Sure we could simply upgrade the ACR to a standard or premium tier, but at what cost? A 4x price increase between basic and standard SKU’s, and even steeper 9x to premium. Thankfully, we can solve for this in few ways.

  1. Manage our container size – Start from scratch or a container specific OS like alpine.
  2. Build containers less frequently – We have almost a 50:1 development to production ratio, so there is definitely a bit of wiggle room there.
  3. Manage the registry contents, deleting old or untagged images.

Combining these options will provides our team with a long term and scalable solution. But how can we implement item number 3?

ACR Purge & Automatic Cleanup

As a preview feature, Azure Container Registry now supports filter based cleanup of images and containers. This can be completed as an ad-hoc process or as a scheduled task. To get things right, I’ll first build an ACR command that deletes tagged images.

# Environment variable for container command line
PURGE_CMD="acr purge \
  --filter 'container/myimage:dev-.*' \
  --ago 3d --dry-run"

az acr run \
  --cmd "$PURGE_CMD" \
  --registry mycontainerregistry \
  /dev/null

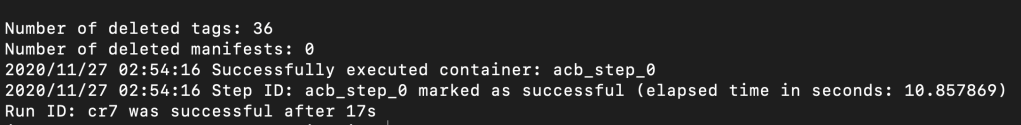
I’ve set an agreed upon container age for my containers and I’m quite selective of which containers I purge. The above dry-run only selects the development “myimage” container and gives me a nice example of what my task would actually do.

Including multiple filters in purge commands is supported. So, feel free to build expansive query sets. Once you are happy with the dry run output, it’s time to setup an automatic job. ACR uses standard cronjob syntax for scheduling, so this should be a pretty familiar experience for linux administrators.

PURGE_CMD="acr purge \
  --filter 'container/my-api:dev-.*' \
  --filter 'container/my-db:dev-.*' \
  --ago 3d"

az acr task create --name old-container-purge \
  --cmd "$PURGE_CMD" \
  --schedule "0 2 * * *" \
  --registry mycontainerregistry \
  --timeout 3600 \
  --context /dev/null

And just like that, we have a task which will clean up our registry daily at 2am.

As an ARM template please?

If you’re operating or deploying multiple container registries for various teams, you might want to standardise this type of task across the board. As such, integrating this into your ARM templates would be mighty useful.

Microsoft provides the “Microsoft.ContainerRegistry/registries/tasks” resource type for deploying these actions at scale. There is, however, a slightly irritating quirk. Your ACR command must be base64 encoded YAML following the tasks specification neatly documented here. I’m not sure about our readers, but generally combining Base64, YAML and JSON leaves a nasty taste in my mouth!

{
    "$schema": "https://schema.management.azure.com/schemas/2019-04-01/deploymentTemplate.json#",
    "contentVersion": "1.0.0.0",
    "parameters": {
        "containerRegistryName": {
            "type": "String",
            "metadata": {
                "description": "Name of the ACR to deploy task resource."
            }
        },
        "containerRegistryTaskName" : {
            "defaultValue": "old-container-purge",
            "type": "String",
            "metadata": {
                "description": "Name for the ACR Task resource."
            }
        },
        "taskContent" : {
            "defaultValue": "dmVyc2lvbjogdjEuMS4wCnN0ZXBzOiAKICAtIGNtZDogYWNyIHB1cmdlIC0tZmlsdGVyICdjb250YWluZXIvbXktYXBpOmRldi0uKicgLS1maWx0ZXIgJ2NvbnRhaW5lci9teS1kYjpkZXYtLionIC0tYWdvIDNkIgogICAgZGlzYWJsZVdvcmtpbmdEaXJlY3RvcnlPdmVycmlkZTogdHJ1ZQogICAgdGltZW91dDogMzYwMA==",
            "type": "String",
            "metadata": {
                "description": "Base64 Encoded YAML for the ACR Task."
            }
        },
        "taskSchedule"  : {
            "defaultValue": "0 2 * * *",
            "type": "String",
            "metadata": {
                "description": "CRON Schedule for the ACR Task resource."
            }
        },
        "location": {
            "type": "string",
            "defaultValue": "[resourceGroup().location]",
            "metadata": {
                "description": "Location to deploy the ACR Task resource."
            }
        }
    },
    "functions": [],
    "variables": {},
    "resources": [
        {
            "type": "Microsoft.ContainerRegistry/registries/tasks",
            "name": "[concat(parameters('containerregistryName'), '/', parameters('containerRegistryTaskName'))]",
            "apiVersion": "2019-06-01-preview",
            "location": "[parameters('location')]",
            "properties": {
                "platform": {
                    "os": "linux",
                    "architecture": "amd64"
                },
                "agentConfiguration": {
                    "cpu": 2
                },
                "timeout": 3600,
                "step": {
                    "type": "EncodedTask",
                    "encodedTaskContent": "[parameters('taskContent')]",
                    "values": []
                },
                "trigger": {
                    "timerTriggers": [
                        {
                            "schedule": "[parameters('taskSchedule')]",
                            "status": "Enabled",
                            "name": "t1"
                        }
                    ],
                    "baseImageTrigger": {
                        "baseImageTriggerType": "Runtime",
                        "status": "Enabled",
                        "name": "defaultBaseimageTriggerName"
                    }
                }
            }
        }
    ],
    "outputs": {}
}

The above encoded base64 translates to the following YAML. Note that it includes the required command and some details about the execution timeout limit. For actions that purge a large amount of containers, Microsoft advises you might need to increase this limit beyond the default 3600 seconds (1 Hour).

version: v1.1.0
steps: 
  - cmd: acr purge --filter 'container/my-api:dev-.*' --filter 'container/my-db:dev-.*' --ago 3d"
    disableWorkingDirectoryOverride: true
    timeout: 3600

Summary

Hopefully, you have found this blog post informative and useful. There are a number of scenarios for this feature-set; deleting untagged images, cleaning up badly named containers or even building new containers from scratch. I’m definitely excited to see this feature move to general availability. As always, please feel free to reach out if you would like to know more. Until next time!

Attempting to use Azure ARC on an RPi Kubernetes cluster

Recently I’ve been spending a fair bit of effort working on Azure Kubernetes Service. I don’t think it really needs repeating, but AKS is an absolutely phenomenal product. You get all the excellence of the K8s platform, with a huge percentage of the overhead managed by Microsoft. I’m obviously biased as I spend most of my time on Azure, but I definitely find it easier than GKE & EKS. The main problem I have with AKS is cost. Not for production workloads or business operations, but for lab scenarios where I just want to test my manifests, helm charts or whatever. There’s definitely a lot of options for spinning up clusters on demand for lab scenarios or even reducing cost of an always present cluster; Terraform, Kind or even just right sizing/power management. I could definitely find a solution that fits within my current Azure budget. Never being one to take the easy option, I’ve taken a slightly different approach for my lab needs. A two node (soon to be four) Raspberry Pi Kubernetes cluster.

Besides just being cool, It’s great to have a permanent cluster available for personal projects, with the added bonus that my Azure credit is saved for more deserving work!

That’s all good and well I hear you saying, but I needed this cluster to lab AKS scenarios right? Microsoft has been slowly working to integrate “non AKS” Kubernetes into Azure in the form of ARC enabled clusters – Think of this almost as an Azure compete to Google Anthos, but with so much more. The reason? Arc doesn’t just cover the K8s platform and it brings a whole host of Azure capability right onto the cluster.

The setup

Configuring a connected ARC cluster is a monumentally simple task for clusters which meet muster. Two steps to be exact.

1. Enable the preview azure cli extensions

az extension add --name connectedk8s
az extension add --name k8sconfiguration

2. Run the CLI commands to enable an ARC enabled cluster

az connectedk8s connect --name RPI-KUBENETES-LAB --resource-group KUBERNETESARC-RG01

In the case of my Raspberry Pi cluster – arm64 architecture really doesn’t cut it. Shortly after you run your commands you will receive a timeout and discover pods stuck in a pending state.

Timeouts like this are never good.
Our very suck pods.

Digging into the deployments, it quickly becomes obvious that an amd64 architecture is really needed to make this work. Pods are scheduled across the board with a node selector. Removing this causes a whole host of issues related to what looks like both container compilation & software architecture. For now it looks like I might be stuck with a tantalising object in Azure & a local cluster for testing. I’ve become a victim of my own difficult tendencies!

So close, yet so far.

Right for you?

There is a lot of reasons to run your own cluster – Generally speaking, if you’re doing so you will be pretty comfortable with the Kubernetes ecosystem as a whole. This will just be “another tool” you could add, and you should apply the same consideration for every other service you consider using. In my opinion the biggest benefit of the service is the simplified/centralised management plane across multiple clusters. This allows me to manage my own (albeit short lived) AKS clusters and my desk cluster with centralised policy enforcement, RBAC & monitoring. I would probably look to implement if I was running my datacenter cluster, and definitely if I was looking to migrate to AKS in the future. If you are considering, keep in mind a few caveats;

  1. The Arc Service is still in preview – expect a few bumps as the service grows
  2. Currently only available in EastUS & WestEurope – You might be stuck for now if operating under data residency requirements.

At this point in time, I’ll content myself with local cluster. Perhaps I’ll publish a future blog post if I manage to work through all these architecture issues. Until next time, stay cloudy!

Security Testing your ARM Templates

In medicine there is a saying “an ounce of prevention is worth a pound of cure”” – What this concept boils down to for health practitioners is that engaging early is often the cheapest & simplest method for preventing expensive & risky health scenarios. It’s a lot cheaper & easier to teach school children about healthy foods & exercise than to complete a heart bypass operation once someone has neglected their health. Importantly, this concept extends to multiple fields, with CyberSecurity being no different.
Since the beginning of cloud, organisations everywhere have seen explosive growth in infrastructure provisioned into Azure, AWS and GCP. This explosive growth all too often corresponds with increases to security workload without required budgetary & operational capability increases. In the quest to increase security efficiency and reduce workload, this is a critical challenge. Once a security issue hits your CSPM, Azure Security Centre or AWS Trusted Inspector dashboard, it’s often too late; The security team now has to work to complete within a production environment. Infrastructure as Code security testing is a simple addition to any pipeline which will reduce the security group workload!

Preventing this type of incident is exactly why we should complete BASIC security testing..

We’ve already covered quality testing within a previous post, so today we are going to focus on the security specific options.

The first integrated option for ARM templates is easily the Azure Secure DevOps kit (AzSK for short). The AzSK has been around for while and is published by the Microsoft Core Services and Engineering division; It provides governance, security IntelliSense & ARM template validation capability, for free. Integrating to your DevOps Pipelines is relatively simple, with pre-built connectors available for Azure DevOps and a PowerShell module for local users to test with.

Another great option for security testing is Checkov from bridgecrew. I really like this tool because it provides over 400 tests spanning AWS, GCP, Azure and Kubernetes. The biggest drawback I have found is the export configuration – Checkov exports JUnit test results, however if nothing is applicable for a specified template, no tests will be displayed. This isn’t a huge deal, but can be annoying if you prefer to see consistent tests across all infrastructure…

The following snippet is all you really need if you want to import Checkov into an Azure DevOps pipeline & start publishing results!

  - task: UsePythonVersion@0
    inputs:
      versionSpec: '3.7'
      addToPath: true
    displayName: 'Install Python 3.7'
  
  - script: python -m pip install --upgrade pip setuptools wheel
    displayName: 'Install pip3'

  - script: pip3 install checkov
    displayName: 'Install Checkov using pip3'

  - script: checkov -d ./${{parameters.iacFolder}} -o junitxml -s >> checkov_sectests.xml
    displayName: 'Security test with Checkov'

  - task: PublishTestResults@2
    displayName: Publish Security Test Results (Checkov)
    condition: always()
    inputs:
      testResultsFormat: JUnit
      testResultsFiles: '**sectests.xml'

When to break the build & how to engage..

Depending on your background, breaking the build can really seem like a negative thing. After all, you want to prevent these issues getting into production, but you don’t want to be a jerk. My position on this is that security practitioners should NOT break the build for cloud infrastructure testing within dev, test and staging. (I can already hear the people who work in regulated environments squirming at this – but trust me, you CAN do this). While integration of tools like this is definitely an easy way to prevent vulnerabilities or misconfigurations from reaching these environments, the goal is to raise awareness & not increase negative perceptions.

Security should never be the first team to say no in pre-prod environments.

Use the results of any tools added into a pipeline as a chance to really evangelize security within your business. Yelling something like “Exposing your AKS Cluster publicly is not allowed” is all well and good, but explaining why public clusters increase organisational risk is a much better strategy. The challenge when security becomes a blocker is that security will no longer be engaged. Who wants to deal with the guy who always says no? An engaged security team has so much more opportunity to educate, influence and effect positive security change.

Don’t be this guy.

Importantly, engaging well within dev/test/sit and not being that jerk who says no, grants you a magical superpower – When you do say no, people listen. When warranted, go ahead and break the build – That CVSS 10.0 vulnerability definitely isn’t making it into prod. Even better, that vuln doesn’t make it to prod WITH support of your development & operational groups!

Hopefully this post has given you some food for thought on security testing, until next time, stay cloudy!

Note: Forest Brazael really has become my favourite tech related comic dude. Check his stuff out here & here.

Happy Wife Happy Life – Building my wedding invites in Python on Azure!

One of the many things I love about the cloud is the ease at which it allows me to develop and deploy solutions. I recently got married – An event which is both immensely fulfilling and incredibly stressful to organise. Being a digital first millennial couple, my partner and I wanted to deliver our invites electronically. Being the stubborn technologist that I am, I used the wedding as an excuse to practice my cloud & python skills! This blog neatly summarises what I implemented, and the fun I dealt with along the way.

The Plan – How do I want to do this?

For me, the main goal moving was to deliver a simple, easy to use solution which enabled me to keep sharp on some cloud technology, time and complexity was not a deciding factor. Being a consultant, I generally touch a multitude of different services/providers and I need to keep challenged to stay up to date on a broad range of things.

For my partner, it was important that I could quickly deliver a website, at low cost, with personalised access codes and email capability – A fully fledged mobile app would have been the nirvana, but I’m not that great at writing code (yet) – Sorry hun, maybe at a future vow renewal?

When originally planning, I really wanted to design a full end to end solution using functions & all the cool serverless features. I quickly realised that this would also take me too long to keep my partner happy, so I opted for a simpler path – an ACI deployment, with Azure Traffic manager allowing a nice custom domain (Feature request please MS). I designed Azure Storage as a simple table backend, and utilised SendGrid as the email service. Azure DNS allowed me to host all the relevant records, and I built my containers for ACR Using Azure DevOps.

Slapping together wedding invites on Azure in an afternoon? Why not?

Implementing – How to use this flask thing?

Ask anyone who knows me and they will tell you I will give just about anything a crack. I generally use python when required for scripting/automation and I really don’t use it for much beyond that. When investigating how to build a modern web app, I really liked the idea of learning some more python – It’s such a versatile language and really deserves more of my attention. I also looked at using React, WordPress & Django. However I really hate writing javascript, this blog is WordPress so no learning there, and Django was have been my next choice after flask.

Implementing into flask was actually extremely simple for basic operations. I’m certain I could have implemented my routing in a neater manner – perhaps a task for future refactoring/pull requests! I really liked the ability to test flask apps by simply running python3 app.py. A lot quicker than a full docker build process, and super useful in development mode!

The template based model that flask enables developers to utilise is extremely quick. Bootstrap concepts haven’t really changed since it was released in 2011, and modifying a single template to cater for different users was really simple.

For user access, I used a simple model where a code was utilised to access the details page, and this code was then passed through all the web requests from then on. Any code submitted that did not exist in azure storage simply fired a small error!

import flask 
from string import Template
from flask import request
from flask import render_template
from flask import redirect
import os
from datetime import datetime
from azure.cosmosdb.table.tableservice import TableService
from azure.cosmosdb.table.models import Entity

app = flask.Flask(__name__)
app.config['StorageName'] = os.environ.get('StorageName')
app.config['StorageKey'] = os.environ.get('StorageKey')

#StorageName = os.environ.get('StorageName')
#StorageKey = os.environ.get('StorageKey')
@app.route('/', methods=['GET'])
def home():
    return render_template('index.html')  # render a template

@app.route('/badCode')
def badCode():
    return render_template('index.html', formError = "Incorrect Code, Please try again.")

@app.route('/user/<variable>', methods=['GET'])
def userpage(variable):
    table_service = TableService(account_name=app.config['StorageName'], account_key=app.config['StorageKey'])
    name= variable.lower()
    try:
        details = table_service.get_entity('weddingtable', 'Invites', name)
        print(details)
        return render_template("user.html",People1=details.Names, People2=details.Names2, hide=details.Hide, userCode = variable, commentmessage=details.Message)
    except:
        return redirect('/badCode')


@app.route('/locations')
def locations():
    return render_template('locations.html',HomeLink="./")

@app.route('/locations/<UserCode>')
def authedUser(UserCode):
    link = "../user/" + UserCode
    return render_template('locations.html',HomeLink=link)

@app.route('/code', methods=['POST'])
def handle_userCode():
    codepath = '/user/' + request.form['personalCode']
    return redirect(codepath)

@app.route('/Thankyou/<UserCode>')
def thank(UserCode):

    codepath = '/user/' + UserCode
    return render_template('thankyou.html', HomeLink=codepath)

@app.route('/RSVP', methods=['POST'])
def handle_RSVP():
    print('User Code Is: {}'.format(request.form['userCode']))
    table_service = TableService(account_name=app.config['StorageName'], account_key=app.config['StorageKey'])
    now = datetime.now()
    time = now.strftime("%m-%d-%Y %H-%M-%S")
    rsvp = {'PartitionKey': 'rsvp', 'RowKey': time ,'GroupID': request.form['userCode'],
        'comments': request.form['comment'], 'Status': request.form['action']}
    print(rsvp)
    table_service.insert_entity('weddingrsvptable', rsvp)
    redirectlink = '/Thankyou/{}'.format(request.form['userCode'])
    return redirect(redirectlink)

app.run(host='0.0.0.0', port=80, debug=True)

The end result of my bootstrap & flask configuration was really quite simple – my Fiance was quite impressed!

Deployment – Azure DevOps, ACI, ARM & Traffic Manager

Deploying to Azure Container Registry and Instances is almost 100% idiotproof within Azure DevOps. Within about five minutes in the GUI, you can get a working pipeline with a docker build & push to your Azure Container Registry, and then refresh your Azure Container Instances from there. Microsoft doesn’t really recommend using ACI for anything beyond a simple workloads, and I found support for nearly everything to be pretty limited.
Because I didn’t want a fully fledged AKS cluster/host or an App Service Plan running containers, I used traffic manager to work around the custom domain limitations of ACI. As a whole, the traffic manager profile would cost me next to nothing, and I knew that I wouldn’t be receiving many queries to the services.

At some point I looked at deploying my storage account using ARM templates, however I found that table storage is currently not supported for deployment using this method. You will notice that my azure pipeline uses the Azure Shell commands to do this. I didn’t get around to automating the integration from storage to container instances – Mostly because I had asked my partner to fill out another storage account table manually and didn’t want to move anything!

trigger:
- master

pool:
  vmImage: 'ubuntu-latest'

variables:
  imageName: 'WeddingContainer'

steps:
- task: Docker@2
  inputs:
    containerRegistry: 'ACR Connection'
    repository: 'WeddingWebsite'
    command: 'buildAndPush'
    Dockerfile: 'Dockerfile'
    tags: |
      v1
- task: Docker@2
  inputs:
    containerRegistry: 'ACR Connection'
    command: 'login'

- task: AzureCLI@2
  inputs:
    azureSubscription: 'PAYG - James Auchterlonie(2861f6bf-8886-47a9-bc4b-de1a11df0e5f)'
    scriptType: 'bash'
    scriptLocation: 'inlinescript'
    inlineScript: 'az storage account create --name weddingazdevops --resource-group CONTAINER-RG01 --location australiaeast --sku Standard_LRS --kind StorageV2'

- task: AzureCLI@2
  inputs:
    azureSubscription: 'PAYG - James Auchterlonie(2861f6bf-8886-47a9-bc4b-de1a11df0e5f)'
    scriptType: 'bash'
    scriptLocation: 'inlineScript'
    inlineScript: 'az storage table create -n weddingtable --account-name weddingazdevops'

- task: AzureCLI@2
  inputs:
    azureSubscription: 'PAYG - James Auchterlonie(2861f6bf-8886-47a9-bc4b-de1a11df0e5f)'
    scriptType: 'bash'
    scriptLocation: 'inlineScript'
    inlineScript: 'az container create --resource-group CONTAINER-RG01 --name weddingwebsite --image youracrnamehere.azurecr.io/weddingwebsite:v1 --dns-name-label weddingwebsite --ports 80 --location australiaeast --registry-username youracrname --registry-password $(ACRSECRET) --environment-variables StorageName=$(StorageName) StorageKey=$(StorageKey)'

- task: AzureCLI@2
  inputs:
    azureSubscription: 'PAYG - James Auchterlonie(2861f6bf-8886-47a9-bc4b-de1a11df0e5f)'
    scriptType: 'bash'
    scriptLocation: 'inlineScript'
    inlineScript: 'az container restart --name weddingwebsite --resource-group CONTAINER-RG01'

For my outbound email I opted to utilise SendGrid. You can actually sign up for this service within the Azure Portal as a “third party service”. It adds an object to your resource group, however administration is still within the SendGrid portal.

Issues?

As an overall service, I found my deployment to be relatively stable. I ran two issues through my deployment, both of which were not too simple to resolve.

1. Azure Credit & Azure DNS – About halfway through the live period after sending my invites, I noticed that my service was down. This was actually due to DNS not servicing requests due to insufficient credit. A SQL server I was also labbing had killed my funds! This was actually super frustrating to fix as I had another unrelated issue with the Owner RBAC on my subscription – My subscription was locked for IAM editing due to insufficient funds, and I couldn’t add another payment method because I was not owner – Do you see the loop too?
I would love to see some form of payment model that allows for upfront payment of DNS queries in blocks or chunks – Hopefully this would prevent full scale DNS based outages when using Azure DNS and Credit based payment in the future.

2. SPAM – I also had a couple of reports of emails sent from sendgrid being marked as spam. This was really frustrating, however not common enough for me to dig into as a whole, especially considering I was operating in the free tier. I added a DKIM & DMARC Record for my second run of emails and didn’t receive as much feedback which was good.

The Cost – Was it worth it?

All in All the solution I implemented was pretty expensive when compared to other online products and even other Azure services. I could have definitely saved money by using App Services, Azure Functions or even static Azure Storage websites. Thankfully, the goal for me wasn’t to be cheap. It was practice. Even better though, my employer provides me with an Azure Credit for dev/test, so I actually spent nothing! As such, I really think this exercise was 100% worth it.

Summary – Totally learnt some things here!

I really hoped you enjoyed this small writeup on my experience deploying small websites in Azure. I spent a grand total of about three hours over two weeks tinkering on this project, and you can see a mostly sanitised repo here. I definitely appreciated the opportunity to get a little bit better at python, and will likely look to revisit the topic again in the future!

(Heres a snippet of the big day – I’m most definitely punching above my average! 😂)

SCOM of the Earth: Replacing Operations Manager with Azure Monitor (Part Two)

In this blog, we continue where we left off  in part one, spending a bit more time expanding on the capabilities of Azure Monitor. Specifically, how powerful Log Analytics & KQL can be, saving us huge amounts of time and  preventing alert fatigue. If you haven’t already decided whether or not to use SCOM or Azure monitor, head over to the Xello comparison article here.

For now, lets dive in!

Kusto Query Language (KQL) – Not your average query tool.

Easily the biggest change that Microsoft recommends when moving from SCOM to Azure Monitor is to change your alerting mindset. Often organisations get bogged down in resolving meaningless alerts – Azure Monitor enables administrators to query data on the fly, acting on what they know to be bad, rather than what is defined in a SCOM Management Pack. To provide these fast queries, Microsoft developed Kusto Query Language – a big data analytics cloud service optimised for interactive ad-hoc queries over structured, semi-structured, and unstructured data. Getting started is pretty simple and Microsoft have provided cheat-sheets for those of you familiar with SQL or Splunk queries.

What logs do I have?

By default, Azure Monitor will collect and store platform performance data for 30 days. This might be adequate for simple analysis of your virtual machines, but ongoing investigations and detailed monitoring will quickly fall over with this constraint. Enabling extra monitoring is quite simple. Navigate to your work space, select advanced settings, and then data.

From here, you can on board extra performance metrics, event logs and custom logs as required. I’ve already completed this task, electing to on board some Service, Authentication, System & Application events as well as guest level performance counters. While you get platform metrics for performance by default, on-boarding metrics from the guest can be an invaluable tool – Comparing the two can indicate where systems are failing & if you have an underlying platform issue!

Initially, I just want to see what servers I’ve on-boarded so here we run our first KQL Query:

Heartbeat | summarize count() by Computer  

A really quick query and an even quicker response! I can instantly see I have two servers connected to my work space, with a count of heartbeats. If I found no heartbeats, something has gone wrong in my on-boarding process and we should investigate the monitoring agent health.

Show me something useful!

While a heartbeat is a good indicator of a machine being online, it doesn’t really show me any useful data. Perhaps I have a CPU performance issue to investigate. How do I query for that?


Perf | where Computer == “svdcprod01.corp.contoso.com” and ObjectName == “Processor” and TimeGenerated > ago(12h) | summarize avg(CounterValue) by bin(TimeGenerated, 1minutes) | render timechart

Looks like a bit, but in reality this query is quite simple. First, I select my Performance data. Next I filter this down. I want data from my domain controller, specifically CPU performance events from the last 12 hours. Once I have my events, I request a 1 minutes summary of the CPU value and push that into a nice time chart! The result?

perf

Using this graph, you can pretty quickly identify two periods when my CPU has spiked beyond a “normal level”. On the left, I spike twice above 40%. On the right, I have a huge spoke to over 90%. Here is where Microsoft’s new monitoring advice really comes into effect – Monitor what you know, when you need it. As this is a lab domain controller, I know it turns on at 8 am every morning. Note there is no data in the graph prior to this time? I also know that I’ve installed AD Connect & the Okta agent – The CPU increases twice an hour as each data sync occurs. With this context, I can quickly pick that the 90% CPU spike is of concern. I haven’t setup an alert for performance yet, and I don’t have to. I can investigate when and if I have an issue & trace this back with data! My next question is – What started this problem?

If you inspect the usage on the graph, you can quickly ascertain that the major spike started around 11:15 – As the historical data indicates this is something new, it’s not a bad assumption that this is something new happening on the server. Because I have configured auditing on my server and elected to ingest these logs, I can run the following query:


SecurityEvent | where EventID == “4688” and TimeGenerated between(datetime(“2019-07-14 1:15:00”) .. datetime(“2019-07-14 1:25:00”))

This quickly returns me out a manageable 75 records. Should I wish, I could probably manually look through this and find my problem. But where is the fun in that? A quick scan reveals that our friend xelloadmin appears to be logged into the server during the specified time frame. Updated Query?

SecurityEvent | where EventID == “4688” and Account contains “xelloadmin” and TimeGenerated between(datetime(“2019-07-14 1:15:00”) .. datetime(“2019-07-14 1:25:00”))

By following a “filter again” approach you can quickly bring large 10,000 row data sets to a manageable number. This is also great for security response, as ingesting a the correct events will allow you to reconstruct exactly what has happened on a server without even logging in!
Thanks to my intelligent filtering, I’m now able to zero in on what appears to be a root cause. It appears that xelloadmin launched two cmd.exe processes less than a second apart, exactly prior to the CPU spike. Time to log in and check!

Sure enough, these look like the culprits! Terminating both process has resulted in the following graph!

Let’s create alerts and dashboards!

I’m sure you’re thinking at this point, that everything I’ve detailed out is after the fact – More importantly, I had to actively look for this data. You’re not wrong to be concerned about this. Again, this is the big change in mindset that Microsoft is pushing with Azure Monitor – Less alerting is better. Your applications are fault tolerant, loosely coupled and scale to meet demand already right? 

If you need an alert, make sure it matters first. Thankfully, configuration is extremely simple should you require one!
First, work out your alert criteria- What defines that something has gone wrong? In my case, I would like to know when the CPU has spiked to over a threshold. We can then have a look in the top right of our query window- You should notice a “new alert rule” icon. Clicking this will give you a screen like the following: 


The condition is where the magic happens – Microsoft has been gracious enough to provide some pre-canned conditions, and you can write your own KQL should you desire. For the purpose of this blog, we’re going to use a Microsoft rule. 


As you can see, this rule is configured to trigger when CPU hits 50% – Our earlier spike thanks to the careless admin would definitely be picked up by this! Once I’m happy with my alert rule, I can configure my actions – Here is where you can integrate to existing tools like ServiceNow, JIRA or send SMS/Email alerts. For my purposes, I’m going to setup email alerts. 
Finally, I configure some details about my alert and click save!

Next time my CPU spikes, I will get an email from Microsoft to my specified address and I can begin investigating in almost realtime!

The final, best and easiest way for administrators to get quick insights into their infrastructure is by building a dashboard.  This process is extremely simple – Work out your metrics, write your queries and pin the results.

You will be prompted to select your desired dashboard – If you haven’t already created one, you can deploy a new one within your desired resource group! With a properly configured workspace and the right queries, you could easily build a dashboard like the one shown below. For those of you who have Azure Policy in place, please note that custom dashboards deploy to the Central US region by default, and you will need to allow an exception to your policy to create them.

Dashboard

Final Thoughts

If you’ve stuck with me for this entire blog post, thank you! Hopefully by now you’re well aware of the benefits of Azure monitor over System Center Operations Manager. If you missed our other blogs, head on over to Part One or our earlier comparison article! As Always, please feel free to reach out should you have any questions, and stay tuned for my next blog post where I look at replacing System Center Orchestrator with cloud native services!

SCOM of the Earth – Replacing Operations Manager with Azure Monitoring

When first interviewed at Xello, I was asked what I thought of the System Center suite.

Working primarily with Configuration Manager, I had just started managing my day-to-day with Service Manager & Orchestrator. I saw how versatile the platform was, and I loved it. I had also seen how much extra work can be involved when it was deployed and used wrong.

System Center is without a doubt an all powerful product, provided you spend the time to implement it and do it well. Your IT team need to understand the day-to-day operations and have the right people/vendors to pop the hood as required. You need to invest the time; like a lot of Microsoft products, you only get out what you put in.

As I spend more and more time working within Azure Cloud, I find myself less and less in love with System Center. I’ve found I can do nearly anything that System Center does, without the overhead, and easier. In this technical blog series, I’ll be covering how and why you should replace System Center with Azure native services, step-by-step.

Blog One? System Center Operations Manager.

What is System Center Operations Manager (SCOM)?

First cab off the rank for this series is System Center Operations Manager, because if we can’t tell whats going on in my environment, how can we manage it?

For the uninitiated, SCOM is a holistic monitoring solution for your on premise and cloud environment. Operations Manager has deep integration with Windows Services out of the box, and you can extend it using management packs (MP’s) to monitor just about anything. Last time I worked on SCOM, I was able to extend it for monitoring a mainframe from the early 1990’s.

SCOM deployed as a single server or full HA

While you can often get away with a single server deployment, SCOM is often deployed in a fully highly available manner. SCOM can also be deployed in a hierarchy like configuration manager, you can extend it into Azure and it works with multiple AD forests. 

How do we know we’ve succeeded in replacing SCOM?

Before we get into the nitty-gritty, we need to define our success criteria. Personally, I love up-time and cost as a measures of success.. After all, if I can’t consume my service at any time for low cost, have I really done a good job?

I’ll apply the generic Azure Service Level Agreement (SLA) of 99.9% up-time as my key requirement – about 45 minutes of downtime a month.

In order to satisfy this requirement, I estimate I will need a distributed deployment with a minimum of two servers in my management pool.  For demonstration purposes, we’ll assume I’m managing 500 servers in my environment. Using the Microsoft SCOM sizing planner and design advice, I think I’ll need three servers: Two Management servers and one database/reporting server. 

My management servers will be A4v2 ($667.53 ) sized, with my SQL Database server being a D4v3 ($835.91).

Cost for compute? $1503.44 per month. 

For storage, I’ll use the default recommendations for disk size and single disks where possible. 1000GB for my data, with a full year of retention. Three 250GB disks for my operating systems and installations. 

My storage cost? $250.96 per month.

Total cost to beat? 

$1754.39/month -> $21,052.68/per annum. 

Azure Monitor: Cloud native monitoring that’s cheaper than SCOM

Azure Monitor dashboard example

My replacement of choice for SCOM is Azure Monitoring, a cloud native, server-less monitoring solution. Xello has covered SCOM vs Azure Monitor’s key differences previously.

Azure Monitor is integrated into the Microsoft Azure public cloud platform by default and you’ve probably already used it if you’re an Azure administrator. You already see it under every virtual machines overview page, and as options under each services monitoring section.

Under the hood, Azure Monitoring solutions use analytics workspaces to store logs, Kusto Query Language (KQL) to search logs, and solutions to add in pre-built dashboards/queries.

Azure Monitor pricing can be a bit frustrating to predict in advance, but we are going to give it a crack using the calculator.

Our SCOM deployment was monitoring 500 servers, providing integrated alerting, emails, dashboards, reporting and log warehousing. Assuming we deliver the same, and ingest about 0.5GB of data per VM a month, we are going to start with a  $1134.99/month cost. Storage is free for the first 31 days, and remaining 334 days sets us back approximately $96 dollars a month.

We definitely want to monitor the core metrics of our virtual machines – CPU, RAM & disk.  These three alert rules is another $205.96 .

Now for my favourite part: The free stuff. 

  • Dashboards? Free.
  • 1000 ITSM alerts? Free.
  • 1000 emails? Free.
  • Push Notifications? 1000 for free.
  • Web hooks? 100 thousand for free. 

Aside from some metric costs, alerting and monitoring is largely cost free and integrates to a large number of services out of the box with Azure Monitor. Always a bonus when you’re selling a solution to management!

Total cost?


$1436.48/month -> $17,237.40/per annum

In summary, Azure Monitor is definitely cheaper than SCOM in the long-run.

If you’re struggling to understand the differences, Microsoft has an excellent webinar on this process with the top recommendation being to swap out your alerting mindset.

So, what’s the deployment like?

Getting started with Azure Monitor deployment vs SCOM

Getting started with an Azure monitoring deployment is an extremely simple three step process.

It’s also a lot faster than deploying SCOM out of the box, which is a much more tedious process, to say the least.

1. Deploy an OMS Workspace

There aren’t too many options here to be confused about. Simply select a name, location and resource group and you’re on your way. Pricing tiers can no longer be selected; expect an update from Microsoft to remove the option.

Capture


2. On-board your servers

If you’re in Azure, the portal can do all the work for you.

Capture-2
Capture-3

If you are migrating from SCOM, the monitoring agent is the same and can be re configured using your Workspace ID and key.

3. Setup data retention policy

This is currently hidden under “Usage and Estimated Costs” & you can retain up to 730 days within a workspace.

Capture-1

Longer term retention is available, but you can’t query the data on demand.

SCOM vs Azure Monitor: A more cost-effective type of monitoring

Switching to Azure Monitor comes with a change in thinking and a management shift in our approach to monitoring.

Treat your monitoring like a SIEM and tune it to the ninth degree. If you have more than the free 1000 alerts a month, you have tuning to do. Getting your alert levels down ensures that your engineers will only react when it matters, and to the right content.

Work to understand your monitoring needs better.  I’ve made heavy assumptions for our costings today, but there is a whole host of strategies when deploying long term alerting and monitoring.  Answer some basic questions about your business.

  • Are you regulated?
  • Do you have a tiered model for internal systems?
  • Do you require full administrative separation for your log data?
  • Can you collect less data? 

All of these questions help to reduce the cost and maintenance effort further, making your life easier. 

Replacing SCOM with Azure Monitor: Next steps

I hope you enjoyed my comparison of SCOM vs Azure Monitor – and why it’s time to replace System Center Operations Manager with the latest Azure services for lower costs.

Stay tuned for my next blog post, where I’ll work through visualising and analyzing my collected logs in a meaningful manner!

Originally Posted on xello.com.au

Azure Bastion: Remote VM access in your Web browser

One of the many benefits of partnering with Microsoft is that occasionally Xello gets to see, explore and put to the test upcoming products and services ahead of time.

With Azure Bastion finally being announced and released to public preview, we’ve had Bastion for a while and are keen to share our impressions of its capabilities. 

In short, for remote VM access directly in your web browser and private virtual machine access, it’s awesome and well worth looking into.

Today’s blog post from our senior consultant James Auchterlonie will explain what Azure Bastion is, why you should use it, and how to deploy the service in your business.

What is Azure Bastion?

Azure Bastion is designed to allow administrative access to a virtual machine without leaving the browser.

In Microsoft high level architecture for protected services, you can see an IaaS Bastion Host in the bottom left corner. While these hosts do increase security, they come with a few drawbacks; you need to maintain and harden them against vulnerabilities, and you need to pay extra to run them  as they can possibly introduce more vulnerabilities.

Azure Bastion removes the need for this IaaS Virtual machine, simonizing your network footprint, maintenance overhead and allows you to get on with your day-to-day ops.

Azure Bastions example diagram

Why should I use Bastion hosts?

If you haven’t already guessed, Azure Bastion increase security in a number of different ways.

  • Logging: Who accessed what, when and what did they do?
  • Protecting your application against (some) port scanning.
  • Harden a single external endpoint.
  • Prevent rogue SSH/RDP access by adding an additional layer.
  • Slow down attackers.

Some key advantages that Microsoft touts in their official documentation for Azure Bastion include:

  • RDP directly in Azure Portal.
  • SSH directly in Azure Portal.
  • Remote Session over HTML5 (HTTPS/443).
  • No Public IP required on the Azure VM.
  • No hassle of managing NSGs.
  • No Firewall Traversal for RDP/SSH.

How do I turn Azure Bastion on?

Azure Bastion is extremely easy to activate, provided you have the appropriate network size.

First, you need to assign a complete subnet to the service, ensuring that it  is larger than a /27 address space. The subnet must also match the name “AzureBastionSubnet’.

brave_M0JqiHVaop

Next, search for the Azure Bastion service within the Azure Portal. 

brave_chw85d2Agc

Select Create Azure Bastion, and fill out the required details.

brave_YaZdVH4sQI

From here, select Review + Create, and just like that – you have a enabled Azure Bastion for your network.

How do I connect to Azure Bastion for remote VM access?

Once you have enabled Azure Bastion, you can use the existing connection pane within the Azure portal to connect into your virtual machines.

You should now notice an extra “Azure Bastion” section under the connection pop-up.


If successful, you should have a new tab opened within your Web browser of choice. 

brave_0P3WW2p2c8

Azure Bastion: Early Thoughts and Minor Drawbacks

While I write this post, Azure Bastion is in public preview.

If I click publish, someone somewhere at Microsoft would be quite upset with me. There are a couple of caveats that you currently need to  be aware of when using it.

  • Azure Bastion currently doesn’t support Hub + Spoke vnet deployments. You will need to add a Bastion subnet for each vnet that you intend to use. 
  • Azure Bastion is HTML 5 and it does lack a couple of features you might be used to within RDP; I found copy/paste to be a bit flaky.
  • You currently cannot use Azure AD Sign in.
  • There isn’t currently a way to view who is using a Bastion session in the portal – you can use the event logs on each host if you’re desperate to get this information. 

That being said, this is easily one of my favourite ‘little releases’ of 2019 and I hope I can release this post as soon as possible.

The reason for this is the level of separation it provides for administrative hosts within Microsoft Azure.

Combine this solution with Just in Time network access, and you can easily avoid using any internet facing hosts – all with platform native tools. Another big win for Microsoft.

Liked this post? Feel free to reach out to the Xello team for more hands-on guidance on how Azure Bastions can fit your setup. Keep this page bookmarked as we update it with the latest capabilities as Azure Bastion continues to evolve past its public preview stage.

Originally Posted on xello.com.au

Azure Sentinel Preview Impressions – A cloud-native SIEM with teeth

After setting up Windows Virtual Desktop last week, I thought I would continue the preview theme of my blog. Prior to RSA San Francisco, Microsoft announced Azure Sentinel: A cloud first Security information and event management (SIEM) tool built on top of Azure Log Analytics, Logic Apps & Jupyter notebooks.

As a huge security geek, Microsoft’s gradual push into the security space is something I will always welcome and I’m really excited to see some competition to Splunk’s IT Service Intelligence & AWS Guard duty. The intent from Microsoft is to provide super cool automated threat detection features, while also providing detailed analysis and incident response capability to security operations center (SOC) engineers!

The other side effect of using AI/ML is the reduced alert fatigue. Open any badly tuned SIEM (even some well-tuned ones) and you will quickly realise how many logs a fully operational environment generates. With new cloud services doing a bunch of heavy lifting, SOC engineers can focus on what matters: Responding and investigating. 

Thankfully, deployment for Azure Sentinel is extremely simple – even faster if you’re already using Azure Security Center. Let’s get stuck in!

Azure Sentinel – What you need before you begin

Before you start you will need the following:

  • An active Azure Subscription
  • A couple of pre-configured virtual machines
  • An East US log analytics workspace. Sentinel is East US only while in public preview, but expect this to change as the product nears release date.

To get some useful data in quickly, I’ve already configured Azure Security Center and forced server enrolment. If you’re not using Security Center, it is the best way to get excellent insight into your Azure security standing. The added bonus is on-boarding Sentinel is much easier!

azure_sentinel_walkthrough_screenshot_1

If you need to enable automatic provisioning, you can turn this on with a standard Security Center plan ($15/node). The settings are available from: Security Center > Security Policy > Subscription Settings > Data Collection.

Azure Sentinel – Step #1: Activating Sentinel

Enabling Azure Sentinel is extremely easy – almost too simple for a blog post.

Search for Sentinel in the focus bar on the top of your Azure Portal and select the option with the blue shield. This will take you to Azure Sentinel workspaces, where you can view the sentinel environments already configured.

Rather than utilising one Azure Sentinel instance for a complete subscription, Microsoft has accounted for multiple log analytics workspaces. I think this a really neat method for providing isolation boundaries for different areas of your environment.

azure_sentinel_walkthrough_screenshot_2

Once you’re at this page, click the Connect Workspace button glaring at you and select your pre-configured workspace when prompted.

azure_sentinel_walkthrough_screenshot_3.jpg

Azure Sentinel – Step #2: Setting up connectors

If you managed to complete the worlds easiest activation, you should be faced with the following welcome screen, and Sentinel is now active in your environment. You still need to onboard services and enable functionality, so stick with me for a bit longer.

azure_sentinel_walkthrough_screenshot_4

Select ‘data connectors’ on the right-hand side and be blown away by all the available choices. For this blog, I’ll be onboarding my Azure Security Center, Security Events and Azure Activity. This should give us an initial footprint to see some functionality. In a production configuration, I would hopefully configure the first 9 options at a minimum. Obviously, this is dependent on what services you are utilising.

azure_sentinel_walkthrough_screenshot_5

The Security Center enablement is quite simple. From here, select the menu clicker and enable a Sentinel connection for each subscription you have onboarded – you’re a good azure admin, so that’s all of them.

azure_sentinel_walkthrough_screenshot_6

Remember when I said that using Security Centre makes Sentinel easier? As you can see here, I’ve enabled all events for Security Center and Sentinel has automatically detected this. If you haven’t used Security Center, pick the desired level of logs you want, and select ‘Ok’.

azure_sentinel_walkthrough_screenshot_7

Finally, I’m going to onboard Azure Activity logs. This will give us visibility of what is happening at the platform level, and allow us to hunt for suspicious deployments, privilege escalation or undesired configuration change! Of the three services I have onboarded, this one is the most complex, requiring a grand total of 4 clicks. Quite exhausting, isn’t it?

azure_sentinel_walkthrough_screenshot_8
azure_sentinel_walkthrough_screenshot_9
azure_sentinel_walkthrough_screenshot_10

At this point, I would recommend shutting down your computer and taking a walk to your nearest pub for a well-earned Furphy.

Sentinel takes a little bit of time to start seeing logs, and a bit longer to gain some actionable log data.

Like a well-seasoned TV chef, here’s a snapshot I created earlier.

azure_sentinel_walkthrough_screenshot_11

Azure Sentinel – Step #3: Activating Machine Learning

You now have a functioning SIEM and can begin to analyse and respond to events within your environment. Congratulations!

From here, it’s time to leverage one of the largest selling points of Azure Sentinel – it’s machine learning (ML) capability, titled Fusion.

Intended to reduce alert fatigue and increase productivity, Sentinel Fusion is one of the many cloud products now utilising machine learning. Unfortunately, this isn’t enabled out of the box, and requires you to complete a couple commands to activate.

First, launch cloud shell within your portal.

azure_sentinel_walkthrough_screenshot_12

Next up, update the below command with your subscription ID, resource group name and workspace details and paste it to the console.

azure_sentinel_walkthrough_screenshot_13

You should receive a JSON response if the fusion activation completed successfully.

azure_sentinel_walkthrough_screenshot_14

If you’re not sure and need to validate, use the following command:

azure_sentinel_walkthrough_screenshot_15

At this point in my demo, I don’t actually have enough alerts and services to generate a Azure Sentinel Fusion alert, but if you want to learn more about using fusion, check out the official Microsoft blog post announcement here.

Azure Sentinel – Step #4: Threat Hunting and Playbooks

Now that we’ve configured Azure Sentinel and Fusion Machine Learning, I’m sure you’re excited to investigate threat hunting & automatic remediation (playbooks). Thankfully, both areas in Sentinel are built on top of existing, tried and tested platforms.

For Incident response, Sentinel utilises Azure Logic Apps. Anyone familiar with this product can testify to its versatility and Sentinel presents the complete list of Logic Apps for your subscription under the playbooks section.

azure_sentinel_walkthrough_screenshot_16

Should you wish to create a Logic App specific to Azure Sentinel, you will now notice an extra option within the triggers section.

azure_sentinel_walkthrough_screenshot_17

For hunting and investigation, Azure Sentinel provides a few great sections where SOC engineers can investigate to their hearts content.

For log analysis, Sentinel utilises the OMS workspace, built on top of KQL. Splunk engineers should find the syntax pretty easy to pick up, and Microsoft provides a cheat sheet for those making the transition.

azure_sentinel_walkthrough_screenshot_18

Engineers can utilise these queries to create custom alerts under the analytics configuration section. These alerts then generate cases when a threshold is met and will soon be able to activate a pre-configured runbook (currently a placeholder is shown in the configuration section).

If you’re new to threat hunting, SANS provides some quick reference posters like this detailed Windows one and deep dives on a multitude of security topics within its reading room! The following alert rule triggers when multiple deployments occur in the specified time-frame.

azure_sentinel_walkthrough_screenshot_19

.

My alert generates a case, which engineers can then investigate as demonstrated below.

azure_sentinel_walkthrough_screenshot_21

In-depth investigation often requires detailed and expansive notes, and this is where the final investigation tool really shines.

The last option under threat management is Notebooks, driven by the open source Jupyter project. Clicking this menu option will take you out of the standard Azure portal and into Notebooks Azure.

If I had to pick one thing I dislike about Azure Sentinel, the separate notebooks page would be it. I really hope that this can be brought into the Azure portal at some point, but I do understand the complexity of the notebook’s functionality. Here you can view existing projects, create new ones or clone them from other people.

azure_sentinel_walkthrough_screenshot_22

Covering all the functionality of Jupyter notebooks could be a blog series on its own, so head over to the open source homepage to see what it’s all about.

Azure Sentinel Impressions – The Xello Verdict

Overall, I’m really impressed with the product. While certain parts are quite clearly in preview and still require work, this is a confident first step into cloud SIEM market. If you’re evaluating early like myself, get used to seeing the following words throughout the product.

There really is a large amount of functionality in the pipeline, so Azure Sentinel only gets better from here. I’m especially excited to see the integrations with other cloud providers and have already signed up to preview the AWS guard duty integration.

If you want to dive straight into the Sentinel deep end, have a look at the GitHub page – there is a thriving community already committing a wealth of knowledge. Prebuilt notebooks, queries and playbooks should really help you adopt the product.

Originally Posted on xello.com.au

Windows Virtual Desktop: Public Preview Deployment Experience & Thoughts

As a long-suffering Citrix and RDS administrator, I’ve eagerly awaited the release of Microsoft’s virtual desktop offering that was announced at last year’s Microsoft Ignite – to put it to the test.

With Windows Virtual Desktop finally entering public preview, I took the chance to explore what the service offers and write up a blog post on my deployment experience, the “gotchas” I ran into, and some initial thoughts. Fair warning – this is a long article, so skip to the end if you want my verdict!

Windows Virtual Desktop – What you need before you begin

Before you start, you will need to have the following:

  • An active Azure Subscription
  • A pre-configured Virtual network & AD Domain
  • A bit of patience: It’s still in preview, and different people are reporting varying levels of success with the deployment.

Thankfully, the deployment process has been well documented by Microsoft and I already had a lab environment set up.

For those wishing to follow along in a safe environment, I’ve placed some Azure Resource Manager (ARM) templates here for deploying some of the prerequisite infrastructure (you still need to configure AD properly).

Now – onto the fun stuff!

Windows Virtual Desktop – Step # 1: Installation

The first thing you will want to do, is grab some useful information and the new PowerShell module.

Locate and note down your AAD tenant ID and subscription ID – you will need these shortly. To install the PowerShell module, use the following command:

command_1_windows_virtual_desktop_guide_xello
Windows Virtual Desktop screenshot 1

You should be able to verify the install with:

command_2_windows_virtual_desktop_guide_xello

The grid view is not needed; it just makes everything so much easier to find!

Windows Virtual Desktop screenshot 2

Windows Virtual Desktop – Step # 2: Tenant setup

Now, open the following URL: https://rdweb.wvd.microsoft.com in two separate tabs.

Take note that we need to complete the next process twice: Once for the service, and once for the client.

In the first window, input your Tenant ID and click submit. You will be asked to sign in and should get back a success message.

In the second window, swap the drop-down to “Client App”, input your tenant ID and submit. Hopefully you will get a second success!

Windows Virtual Desktop screenshot 3

Windows Virtual Desktop – Step # 3: Assigning users, roles and permissions

You should now be able to view the Windows Virtual Desktop within your enterprise applications, as demonstrated in the next screenshot below.

Windows Virtual Desktop screenshot 4

From the Enterprise Apps page, you will need to add an application permission to “Windows Virtual Desktop”; Assign a new user, and the role should be automatically populated as tenant creator.

Windows Virtual Desktop screenshot 5

Windows Virtual Desktop – Step # 4: Powershell

Next, you will create a Virtual Desktop Tenant using PowerShell. The following two commands should complete this, with a slight pause for a password!

command_3_and_4_windows_virtual_desktop_guide_xello

Make sure you keep the tenant name in mind, as you will need this shortly.

Windows Virtual Desktop screenshot 6


I got a bit side tracked at this point, as it looked as if I could specify extra flags for an OMS workspace.

The possibility of on-boarding the service from the first deployment is something I could not pass up.

Sadly, it didn’t appear to function, so I’ve left this as something to investigate as the product comes out of preview!

Windows Virtual Desktop – Step # 5: Session Host Pool

Next, we will create the juiciest part – a session host pool! Navigate to the resource addition section of Azure and look up “Windows Virtual Desktop – Provision a host pool”.

The setup is a simple ClickOps exercise with a couple of gotchas. I won’t dive too deep here, as the portal is self-explanatory. The basics are as follows:

Configure a host pool: Also configure your initial testing users. Jot down the host pool name, as you will need this later.

Windows Virtual Desktop screenshot 7

For the VM configuration: Select how many users you expect, how much usage you expect, and a VM name prefix. Azure only allows 15 characters for VM names, so don’t make this one too long. If you’re labbing the solution, it’s probably good to change the VM size and make sure it’s a single VM – 100 D8S virtual machines really hammers the credit card!

Windows Virtual Desktop screenshot 8

More VM configuration: This time its domain joining and the VNet configuration. Important to call out here, the web portal does not appear to recognise subdomains. Should you utilise a subdomain, you will need to select the “specify domain” option and type it in. I had corp.contoso.com (original, I know) as my domain, so this got me scratching my head for a bit!

Windows Virtual Desktop screenshot 9

Tenant Configuration: This is where you will utilize the Tenant name from those initial PowerShell commands. If you didn’t keep record of it, get-rdstenant is your friend! Use the credentials for the user you specified as “TenantCreator” earlier.

Windows Virtual Desktop screenshot 10

Final cleanup: Validate everything is correct and click deploy! (10 points to anyone who spots the error in the below validation!)

Windows Virtual Desktop screenshot 11

I’ve downloaded the template here, because if you’re not using templates and automation – you’re living in the past. Something for a future blog post! The deployment can take a while depending on your VM sizing, so patience is key.

Windows Virtual Desktop – Step # 6: Test users

Windows Virtual Desktop screenshot 12

If you have followed along with me for this long, well done! Once the deployment is completed, you should be able to log into this page with a test user.

Windows Virtual Desktop screenshot 13

Note: If you need to add extra test users, the doc for that is simple and can be located here.

Windows Virtual Desktop – The Final Verdict

My initial thoughts on the Windows Virtual Desktop product are super positive.

For starters, it’s a huge upgrade from Remote Desktop Services 2016. My key comments and advice when evaluating or troubleshooting are:

  • Pay attention! While most of the deployment is a “next, next” click-through exercise, there is a lot of room for error.
  • The product is in preview and will have undocumented issues, so be careful with your deployment size. While Microsoft takes care of the underlying connection brokering and session management, the default 100 VM deployment is expensive.
  • Don’t test this with an Azure AD account late at night. The solution uses on-premise AD and you will be confused.
  • The product currently only supports Central US & East US 2. This will change as the product comes out of preview but expect some latency in the short term.
Windows Virtual Desktop screenshot 14-1
  • Do you have application configuration or performance requirements? You may need to test them a bit more than normal. Considering Microsoft acquired FSLogix for this reason, I have yet to evaluate how Microsoft worked through performance challenges and non-persistent settings. OneDrive comes to mind in this space.
  • Should you run into errors, the Microsoft Doc and the event logs are your friends. I had to be patient and use the diagnostic commands at different stages when getting used to the product. Don’t be afraid to log into each desktop directly either. Under the hood, it is still Windows 10!

If you want to learn more about Windows Virtual Desktop, or even just grab some advice on deployment, please feel free to reach out to myself and the Xello team!

Like the walkthrough? Stay tuned for Part 2 in my technical blog series, where I’ll next be covering Azure Sentinel and putting its many security benefits to the test.

Originally Posted on xello.com.au