I'm a State Manager for Arinco, with a background specializing in securing Azure cloud and Artificial Intelligence. These days I spend most of my time exploring client problems and buried in pptx decks. I'm passionate about AI, cyber security, cloud native technology and DevOps practices. Hate buzzwords, and love a good rant…
In medicine there is a saying “an ounce of prevention is worth a pound of cure”” – What this concept boils down to for health practitioners is that engaging early is often the cheapest & simplest method for preventing expensive & risky health scenarios. It’s a lot cheaper & easier to teach school children about healthy foods & exercise than to complete a heart bypass operation once someone has neglected their health. Importantly, this concept extends to multiple fields, with CyberSecurity being no different. Since the beginning of cloud, organisations everywhere have seen explosive growth in infrastructure provisioned into Azure, AWS and GCP. This explosive growth all too often corresponds with increases to security workload without required budgetary & operational capability increases. In the quest to increase security efficiency and reduce workload, this is a critical challenge. Once a security issue hits your CSPM, Azure Security Centre or AWS Trusted Inspector dashboard, it’s often too late; The security team now has to work to complete within a production environment. Infrastructure as Code security testing is a simple addition to any pipeline which will reduce the security group workload!
Preventing this type of incident is exactly why we should complete BASIC security testing..
We’ve already covered quality testing within a previous post, so today we are going to focus on the security specific options.
The first integrated option for ARM templates is easily the Azure Secure DevOps kit (AzSK for short). The AzSK has been around for while and is published by the Microsoft Core Services and Engineering division; It provides governance, security IntelliSense & ARM template validation capability, for free. Integrating to your DevOps Pipelines is relatively simple, with pre-built connectors available for Azure DevOps and a PowerShell module for local users to test with.
Another great option for security testing is Checkov from bridgecrew. I really like this tool because it provides over 400 tests spanning AWS, GCP, Azure and Kubernetes. The biggest drawback I have found is the export configuration – Checkov exports JUnit test results, however if nothing is applicable for a specified template, no tests will be displayed. This isn’t a huge deal, but can be annoying if you prefer to see consistent tests across all infrastructure…
The following snippet is all you really need if you want to import Checkov into an Azure DevOps pipeline & start publishing results!
Depending on your background, breaking the build can really seem like a negative thing. After all, you want to prevent these issues getting into production, but you don’t want to be a jerk. My position on this is that security practitioners should NOT break the build for cloud infrastructure testing within dev, test and staging. (I can already hear the people who work in regulated environments squirming at this – but trust me, you CAN do this). While integration of tools like this is definitely an easy way to prevent vulnerabilities or misconfigurations from reaching these environments, the goal is to raise awareness & not increase negative perceptions.
Security should never be the first team to say no in pre-prod environments.
Use the results of any tools added into a pipeline as a chance to really evangelize security within your business. Yelling something like “Exposing your AKS Cluster publicly is not allowed” is all well and good, but explaining why public clusters increase organisational risk is a much better strategy. The challenge when security becomes a blocker is that security will no longer be engaged. Who wants to deal with the guy who always says no? An engaged security team has so much more opportunity to educate, influence and effect positive security change.
Don’t be this guy.
Importantly, engaging well within dev/test/sit and not being that jerk who says no, grants you a magical superpower – When you do say no, people listen. When warranted, go ahead and break the build – That CVSS 10.0 vulnerability definitely isn’t making it into prod. Even better, that vuln doesn’t make it to prod WITH support of your development & operational groups!
Hopefully this post has given you some food for thought on security testing, until next time, stay cloudy!
Note: Forest Brazael really has become my favourite tech related comic dude. Check his stuff out here & here.
With the advent of modern collaboration platforms, users are no longer content to work within the organisational boundary. More and more organisations are being challenged to bring in external partners and users for projects and day to day operations. But how can we do this securely? How do IT managers minimise licensing costs? Most importantly, how can we empower the business to engage without IT? This problem is at the forefront of the thinking behind Azure AD Access Packages. An Azure solution enabling self service onboarding of partners, providers and collaborators at scale. Even better than that, this solution enables both internal and external onboarding. You can and should set this up internally, the less work that IT has to do managing access, the better right?
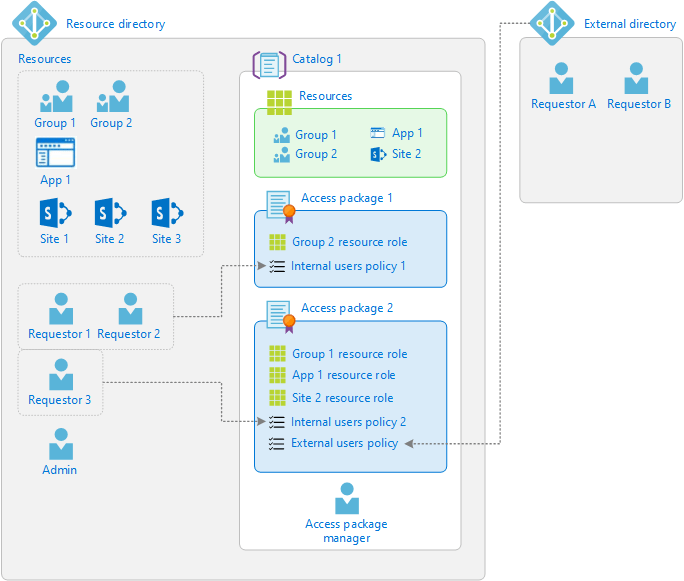
Before we dig too deep, I think a brief overview of how access packages are structured would be useful. On a hierarchy level, packages are placed into catalogs, which can be used to enable multiple packages for a team to use. Each package holds resources, and a policy defines the who and when of requesting access to these using the process. The below diagram from Microsoft neatly sums this up.
Access Package Hierarchy
This all sounds great I hear you saying. So what does this look like? If you have an Office 365 account, you’re welcome to log in and look for yourself here, otherwise a screenshot will have to do.
External Access Package UI
To get started with this solution, you will need an Azure AD P2 licensed tenant. Most organisations will obtain P2 licences this through an M365 E5 subscription, however you can purchase these directly if have M365 E3 or lower and are looking to avoid some costs. You will need to have at-least a 1:1 license assignment for internal use cases, while external identity has recently moved to a “Monthly Active Users” licensing model. One P2 licence in your tenant will license the first 50 thousand external users for free!
Once you’ve enabled this, head on over to the “Identity Governance” blade within Azure AD. This area has a wealth of functionality that benefits nearly all organisations, so I would highly recommend investigating the other items available here. Select Access Packages to get started.
The UI itself for creating an access packages is quite simple, clicking create-new will walk you through a process of assigning applications, groups, teams & share-point sites.
Access Package creation UI
Unfortunately some services like Windows Virtual Desktop will not work with access packages, however this is a service limitation rather than an Azure AD limitation. Expect these challenges to be resolved over time.
At the time of writing, the AzureADPreview module does not support Access Packages. Microsoft Graph beta does however, and so, have an MS Graph based script!
While all this PowerShell might look a bit daunting, understand all that is being done is generating API request bodies and pushing that over 6 basic API calls;
Retrieve information about our specified catalog (General)
Create an Access Package
Add each resource to our specified catalog
Get each resource’s available roles
Assign the resource & role to our Access Packages
Create a Policy which enables assignment of our Access Package
Hopefully this article has provided you with a decent overview of Azure AD Access Packages. There are a lot of benefits when applying this in B2B scenarios, especially when it comes to automating user onboarding & access management. With big investments & changes from Microsoft occurring in this space, expect further growth & new features as the year comes to a close!
Please Note: While we do distribute an access package link within this blog, requests for access are not sent to an monitored email and will not be approved. If you would like to know more, please don’t hesitate reach out as we would be happy to help.
Recently I was approached by a customer regarding a challenge they wanted to solve. How to delegate administrative control of a few users within Azure Active Directory to some lower level administrators? This is a common problem experienced by teams as they move to cloud based directories – a flat structure doesn’t really allow for delegation on business rules. Enter Azure AD Administrative Units; A preview feature enabling delegation & organisation of your cloud directory. For Active Directory Administrators, this will be a quite familiar experience to Organisational Units & delegating permissions. Okta also has a similar functionality, albeit implemented differently.
Active Directory Admins will immediately feel comfortable with Azure AD Admin Units
So when do you want to use this? Basically any time you find yourself wanting a hierarchical & structured directory. While still in preview, this feature will likely grow over time to support advanced RBAC controls and in the interim, this is quite an elegant way to delegate out directory access.
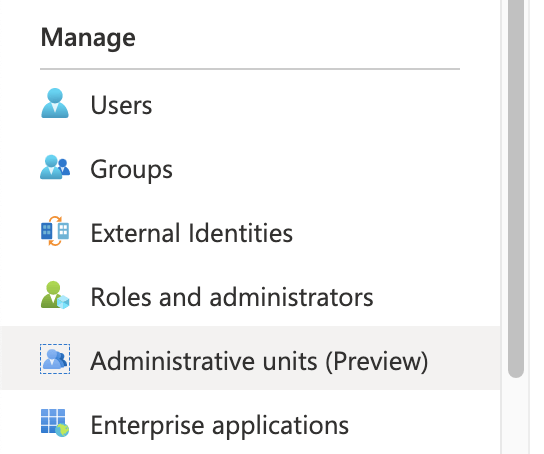
Setting up an Administrative Unit
Setting up an Administrative Unit is quite a simple task within the Azure Portal; Navigate to your Azure AD Portal & locate the option under Manage.
Select Add, and provide your required names & roles. Admin assignment is focused on user & group operations, as device administration has similar capability under custom intune roles and application administrators can be managed via specified roles.
You can also create administrative units using the Azure AD PowerShell Module; A simple one line command will do the trick!
New-AzureADAdministrativeUnit -Description "Admin Unit Blog Post" -DisplayName "Blog-Admin-Users"
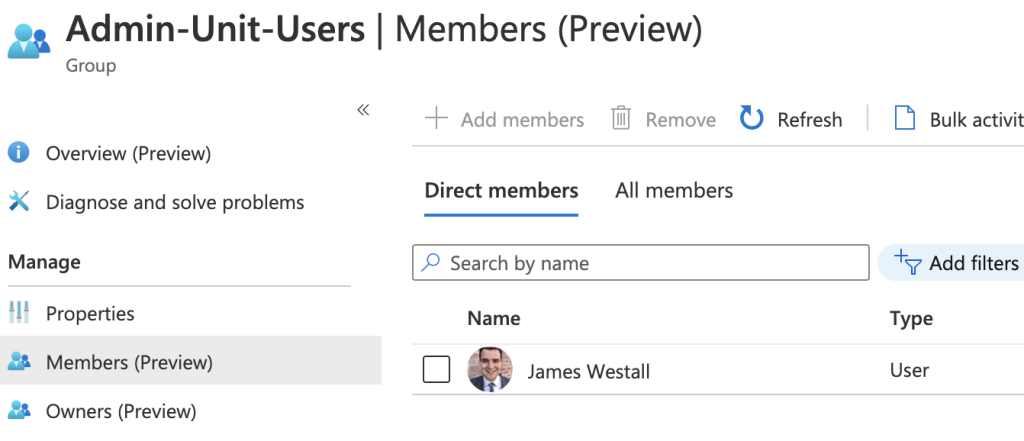
User Management
Once you have created an administrative unit, you can begin to add users & groups. As this point in time, administrative units only support assignment manually, either one by one or via csv upload. The process itself is quite simple; Select Add user and click through everyone you would like to be included.
While this works quite easily for small setups, at scale you would likely find this to be a bit tedious. One way to work around this is to combine Dynamic Groups with your chosen PowerShell execution environment. For me, This is an Automation Account. First, configure a dynamic group which automatically drags in your desired users.
Next, execute the following PowerShell snippet. Note that I am using the Azure AD Preview module, as support is yet to move to the production module.
This can be configured on a schedule as frequently as you need this information to be accurate!
You will note here that one user gets neatly removed from the Administrative Unit – This is because the above PowerShell treats the dynamic group as an authoritative source for Admin Unit Membership. When dealing with assignment through user details (Lifecycle Management) I find that selecting authoritative sources reduces both work effort and confusion. Who wants to do manual management anyway? Should you really want to allow manual addition, simply remove the line marked to remove members!
Hopefully you find this post a useful insight to the usage of Administrative Units within your organisation. There a lot of useful scenarios where this can be leveraged and this feature should most definitely help you minimise administrative privilege in your environment (hooray!). As always, feel free to reach out with any questions or comments! Stay tuned for my next post, where I will be diving into Azure AD Access Packages 🙂
Recently I was asked to assist with implementation of MFA in a complex on-premises environment. Beyond the implementation of Okta, all infrastructure was on-premises and neatly presented to external consumers through an F5 APM/LTM solution. This post details my thoughts & lessons I learnt configuring RADIUS authentication for services behind and F5, utilising AAA Okta Radius servers.
Ideal Scenario?
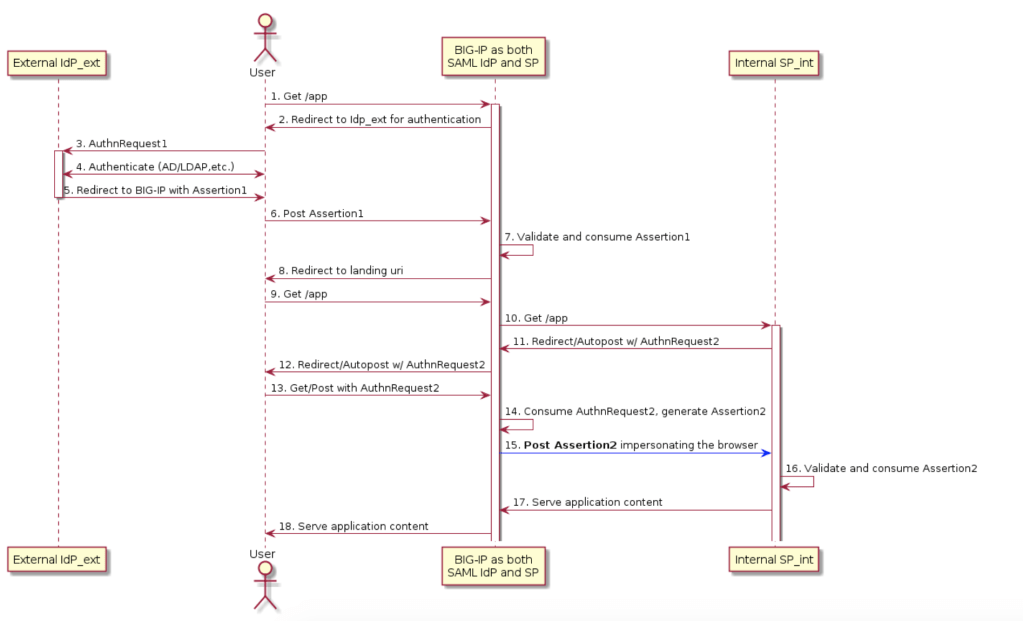
Before I dive into my lessons learnt – I want to preface this article by saying there is a better way. There is almost always a better way to do something. In a perfect world, all services would support token based single sign on. When security of a service can’t be achieved by the best option, always look for the next best thing. Mature organisations excel at finding a balance between what is best, and what is achievable. In my scenario, the best case implementation would have been inline SSO with an external IdP . Under this model, Okta completes SAML authentication with the F5 platform and then the F5 creates and provides relevant assertions to on-premise services.
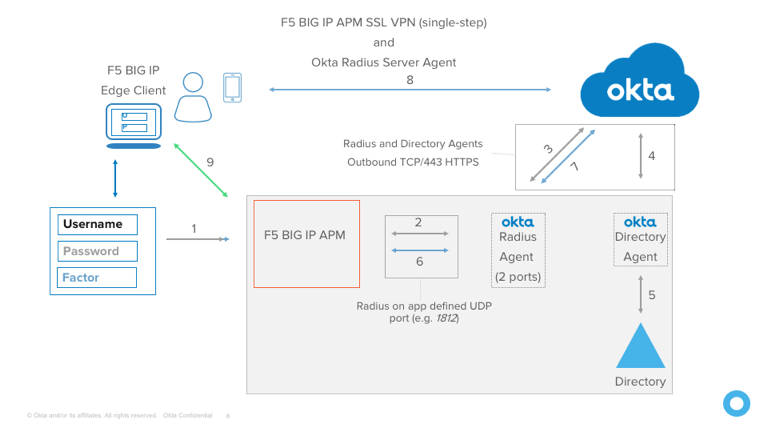
Unfortunately, the reality of most technology environments is that not everything is new and shiny. My internal applications did not support SAML and so here we are with the Okta Radius agent and a flow that looks something like below (replace step 9 with application auth).
Importantly, this is implementation is not inherently insecure or bad, however it does have a few more areas that could be better. Okta calls this out in the documentation for exactly this reason. Something important to understand is that radius secrets can be and are compromised, and it is relatively trivial to decrypt traffic once you have possession of a secret.
APM Policy
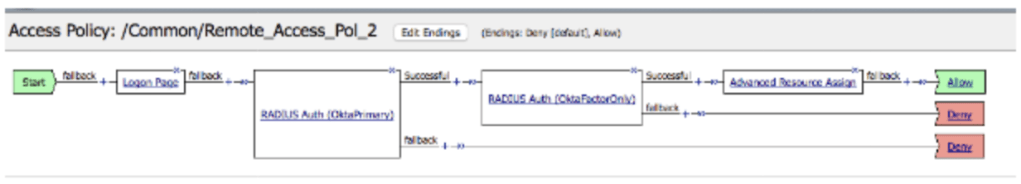
If you have a read of the Okta documentation on this topic. you will quickly be presented with an APM policy example.
You will note there is two Radius Auth blocks – These are intended to separate the login data verification – Radius Auth 1 is responsible for password authentication, and Auth 2 is responsible for verifying a provided token. If you’re using OTP only, you can get away with a simpler APM policy – Okta supports providing both password and an OTP inline and separate by a comma for verification.
Using this option, the policy can be simplified a small amount – Always opt to simplify policy; Less places for things to go wrong!
Inline SSO & Authentication
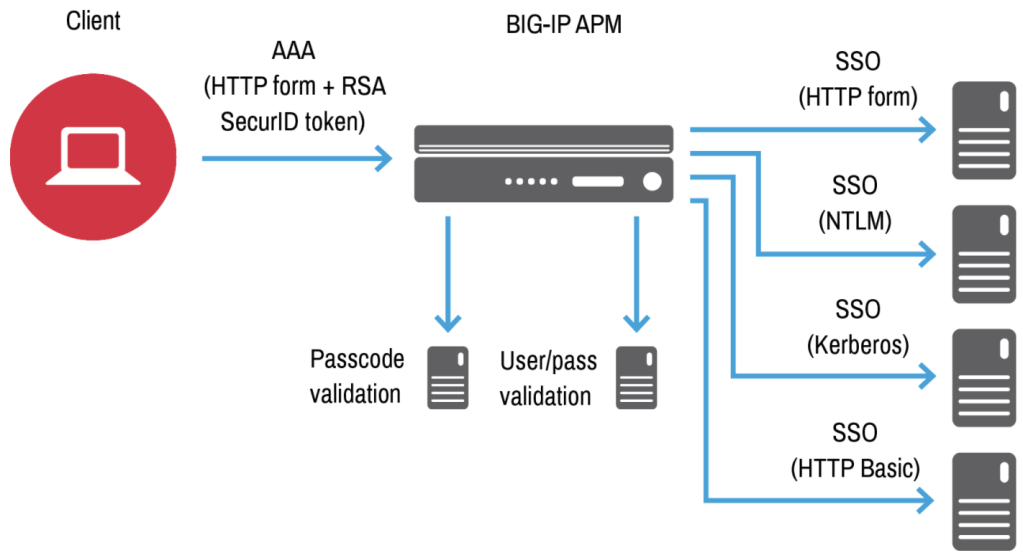
In a similar fashion to Okta, F5 APM provides administrators the ability to pass credentials through to downstream applications. This is extremely useful when dealing with legacy infrastructure, as credential mapping can be used to correctly authenticate a user against a service using the F5. The below diagram shows this using an initial login with RSA SecurID MFA.
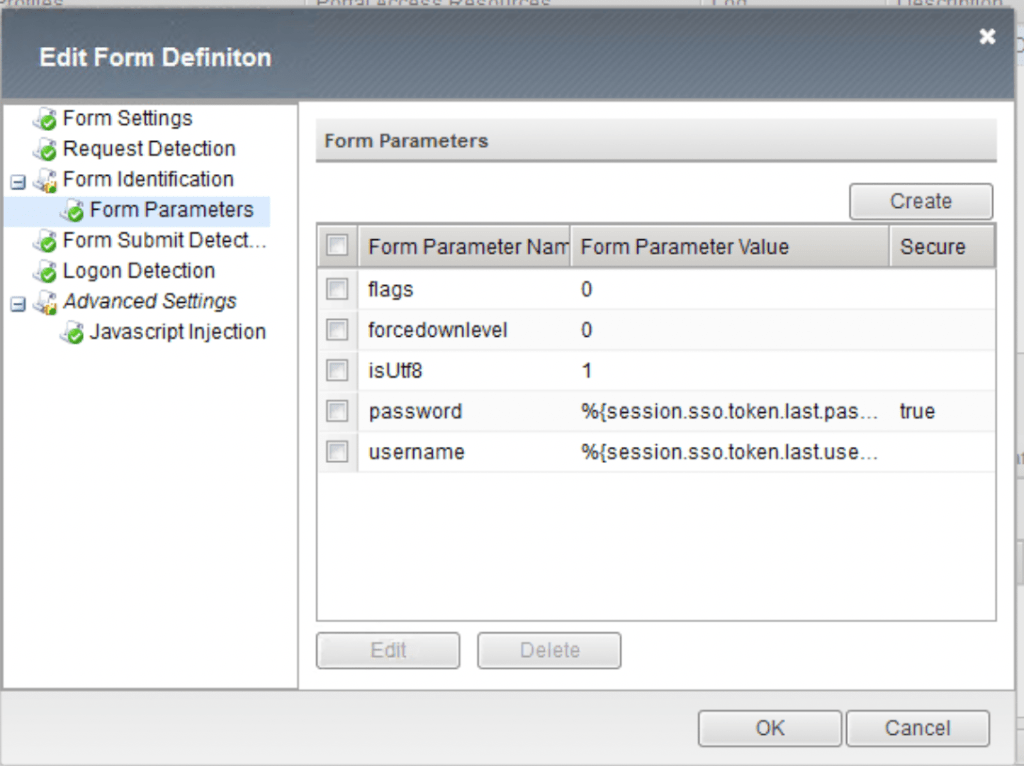
For most of my integrations, I was required to use HTTP forms. When completing this authentication using the APM, having an understanding of exactly how the form is constructed is really critical. The below example is taken from a Exchange form – Leaving out the flags parameter originally left my login failing & me scratching my head.
An annoying detail about forms based inline authentication is that if you already have a session, the F5 will happily auto log back into the target service. This can be a confusing experience for most users as we generally expect to be logged out when we click that logout button. Thankfully, we can handle this conundrum neatly with an iRule.
iRule Policy application
For this implementation, I had a specific set of requirements on when APM policy should be applied to enforce MFA; not all services play nice with extra authentication. Using iRules on virtual services is a really elegant way in which we can control when and APM policy applies. On-Premise Exchange is something that lots of organisations struggle with securing – especially legacy ActiveSync. The below iRule modifies when policy is applied using uri contents & device type.
One thing to be aware of when implementing iRules like this is directory traversal – You really do need a concrete understanding of what paths are and are not allowed. If a determined adversary can authenticate against a desired URI, they should NOT be able to switch to an undesired URI. The above example is really great to show this – I want my users to access personal account ECP pages just fine – Remote administrative exchange access? Thats a big no-no and I redirect to an authorised endpoint.
Final Thoughts
Overall, the solution implemented here is quite elegant, considering the age of some infrastructure. I will always advocate for MFA enablement on a service – It prevents so many password based attacks and can really uplift the security of your users. While overall service uplift is always a better option to enable security, you should never discount small steps you can take using existing infrastructure. As always, leave a comment if you found this article useful!
Recently I spent some time updating my personal technology stack. As an Identity nerd, I thought to myself that SSO everywhere would be a really nice touch. Unfortunately SSO everywhere is not as easy as it sounds – More on that in a future post. For my personal setup, I use Office 365 and have centralised the majority of my applications on Azure AD. I find that the licensing inclusions for my day to day work and lab are just too good to resist. But what about my other love? If you’ve read this blog recently, you will know I’ve heavily invested into the Okta Identity platform. However aside from a root account I really don’t want to store credentials any-more. Especially considering my track record with lab account management. This blog details my experience and tips for setting up inbound federation from AzureAD to Okta, with admin role assignment being pushed to Okta using SAML JIT.
So what is the plan?
For all my integrations, I’m aiming to ensure that access is centralised; I should be able to create a user in AzureAD and then push them out to the application. How this occurs is a problem to handle per application. As Okta is traditionally an identity provider, this setup is a little different – I want Okta to act as the service provider. Queue Inbound Federation. For the uninitiated, Inbound federation is an Okta feature that allows any user to SSO into Okta from an external IdP, provided your admin has done some setup. More commonly, inbound federation is used in hub-spoke models for Okta Orgs. In my scenario, Azure AD is acting as a spoke for the Okta Org. The really nice benefit of this is setup I can configure SSO from either service into my SaaS applications.
Configuring Inbound Federation
The process to configure Inbound federation is thankfully pretty simple, although the documentation could probably detail this a little bit better. At a high level, we’re going to complete 3 SSO tasks, with 2 steps for admin assignment via SAML JIT.
Configure an application within AzureAD
Configure a identity provider within Okta & download some handy metadata
Configure the Correct Azure AD Claims & test SSO
Update our AzureAD Application manifest & claims
Assign Admin groups using SAMIL JIT and our AzureAD Claims.
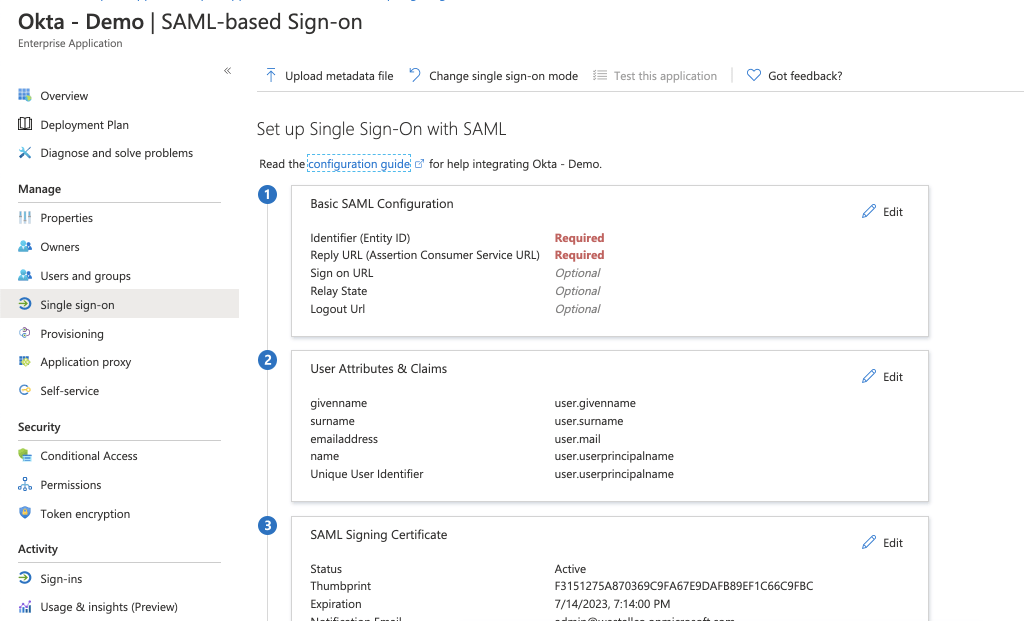
While it does seem like a lot, the process is quite seamless, so let’s get started. First up, add an enterprise application to Azure AD; Name this what you would like your users to see in their apps dashboard. Navigate to SSO and select SAML.
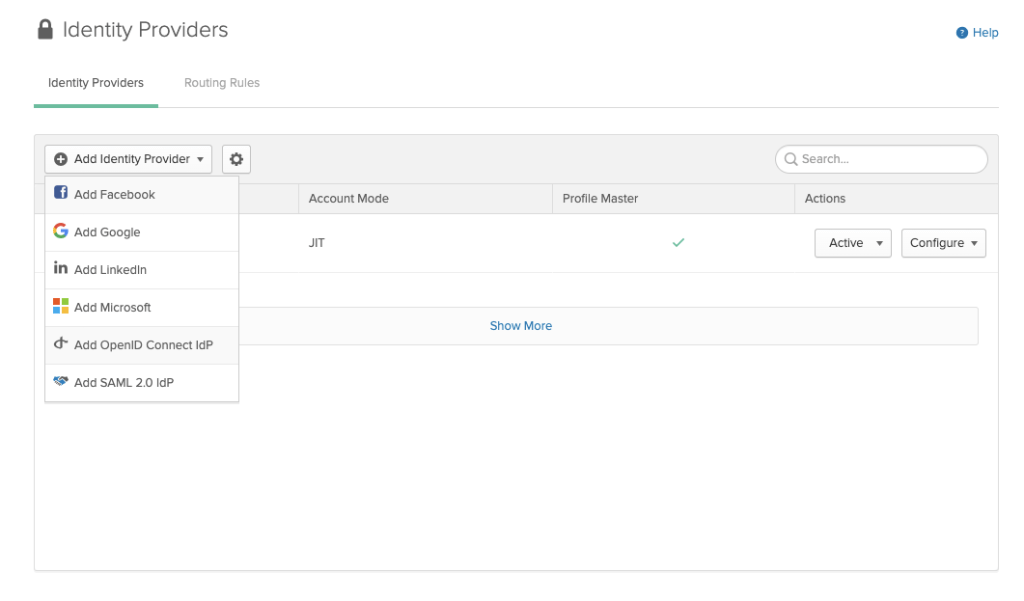
Next, Okta configuration. Select Security>Identity Providers>Add. You might be tempted to select ‘Microsoft’ for OIDC configuration, however we are going to select SAML 2.0 IdP
Using the data from our Azure AD application, we can configure the IDP within Okta. My settings are summarised as follows:
IdP Username should be: idpuser.subjectNameId
SAML JIT should be ON
Update User Attributes should be ON (re-activation is personal preference)
Group assignments are off (for now)
Okta IdP Issuer URI is the AzureAD Identifier
IdP Single Sign-On URL is the AzureAD login URL
IdP Signature Certificate is the Certificate downloaded from the Azure Portal
Click Save and you can download service provider metadata.
Upload the file you just downloaded to the Azure AD application and you’re almost ready to test. Note that the basic SAML configuration is now completed.
Next we need to configure the correct data to flow from Azure AD to Okta. If you have used Okta before, you will know the four key attributes on anyone’s profile: username, email, firstName & lastName. If you inspect the downloaded metadata, you will notice this has slightly changed, with mobilePhone included & username seemingly missing. This is because the Universal Directory maps username to the value provided in NameID. We configured this in the original IdP setup.
Add a claim for each attribute, feeling free to remove the other claims using fully qualified namespaces. My Final claims list looks like this:
At this point, you should be able to save your work ready for testing. Assign your app to a user and select the icon now available on their myapps dashboard. Alternately you can select the “Test as another user” within the application SSO config. If you have issues when testing, the “MyApps Secure Sign In Extension” really comes in handy here. You can grab this from the Chrome or Firefox web store and use it to cross reference your SAML responses against what you expect to be sent. Luckily, I can complete SSO on the first pass!
Adding Admin Assignment
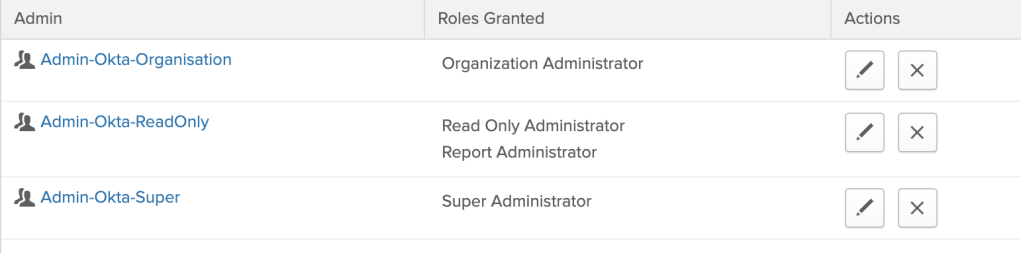
Now that I have SSO working, admin assignment to Okta is something else I would really like to manage in Azure AD. To do this, first I need to configure some admin groups within Okta. I’ve built three basic groups, however you can provide as many as you please.
Next, we need to update the application manifest for our Azure AD app. This can be done at Application Registrations > Appname>Manifest. For each group that you created within Okta, add a new approle like the below, ensuring that the role ID is unique.
For simplicity, I have matched the value, description and displayName details. The ‘value’ attribute for each approle must correspond with a group created within the Okta Portal, however the others can be a bit more verbose should you desire.
Now that we have modified our application with the appropriate Okta Roles, we need to ensure that AzureAD & Okta to send/accept this data as a claim. First within AzureAD, update your existing claims to include the user Role assignment. This can be done with the “user.assignedRoles” value like so:
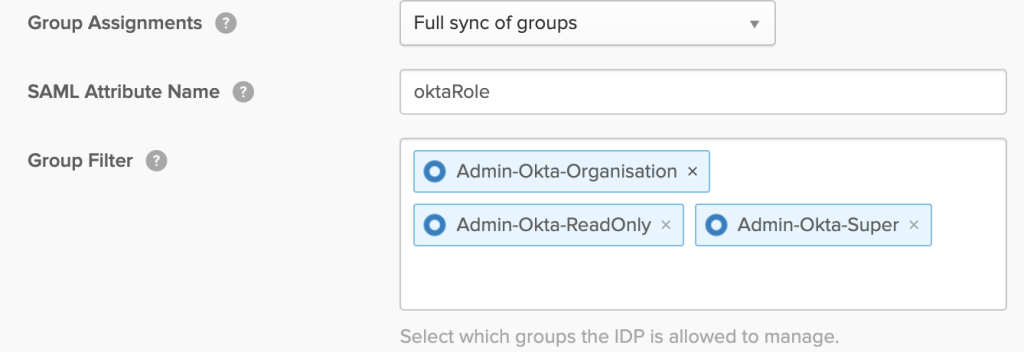
Next, update the Okta IDP you configured earlier to complete group sync like so. Note that the group filter prevents any extra memberships from being pushed across.
For a large amounts of groups, I would recommend pushing attributes as claims and configuring group rules within Okta for dynamic assignment.
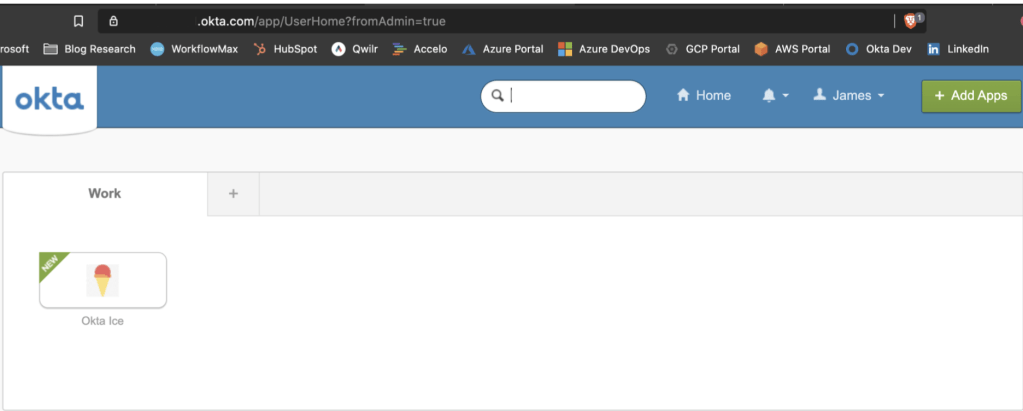
Update your Azure AD user/group assignment within the Okta App, and once again, you’re ready to test. A second sign-in to the Okta org should reveal an admin button in the top right and moving into this you can validate group memberships. In the below example, I’ve neatly been added to my Super admins group.
Wrapping Up
Hopefully this article has been informative on the process for setting up SAML 2.0 Inbound federation using Azure AD to Okta. Depending on your identity strategy, this can be a really powerful way to manage identity for a service like Okta centrally, bring multiple organisations together or even connect with customers or partners. Personally, this type of setup makes my life easier across the board – I’ve even started to minimise the use of my password manager just by getting creative with SSO solutions!
If you’re interested in chatting further on this topic, please leave a comment or reach out!
If you have ever spoken with me in person; you know I’m a huge fan of the Okta identity platform – It just makes everything easy. It’s no surprise then, that the Okta Workflows announcement at Oktane was definitely something I saw value in – Interestingly enough; I’ve utilised postman collections and Azure LogicApps for an almost identical Integration solution in the past.
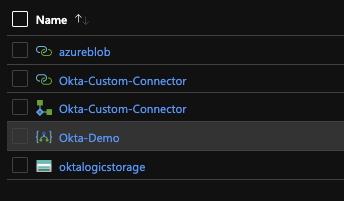
Custom Okta LogicApps Connector
This post will cover my first impressions, workflow basics & a demo of the capability. If you’re wanting to try this in your own Org, reach out to your Account/Customer Success Manager – The feature is still hidden behind a flag in the Okta Portal, however it is well worth the effort!
The basics of Workflows
If you have ever used Azure LogicApps or AWS Step Functions, you will instantly find the terminology of workflows familiar. Workflows are broken into three core abstractions;
Events – Used Start your workflow
Functions – Provide Logic Control (If then and the like) & advanced transformations/functionality
Actions – DO things
All three abstractions have input & output attributes, which can be manipulated or utilised throughout each flow using mappings. Actions & Events require a connection to a service – pretty self explanatory.
Workflows are built from left to right, starting with an event. I found the left to right view when building functions is really refreshing, If you have ever scrolled down a large LogicApp you will know how difficult it can get! Importantly, keeping your flows short and efficient will allow easy viewing & understanding of functionality.
Setting up a WorkFlow
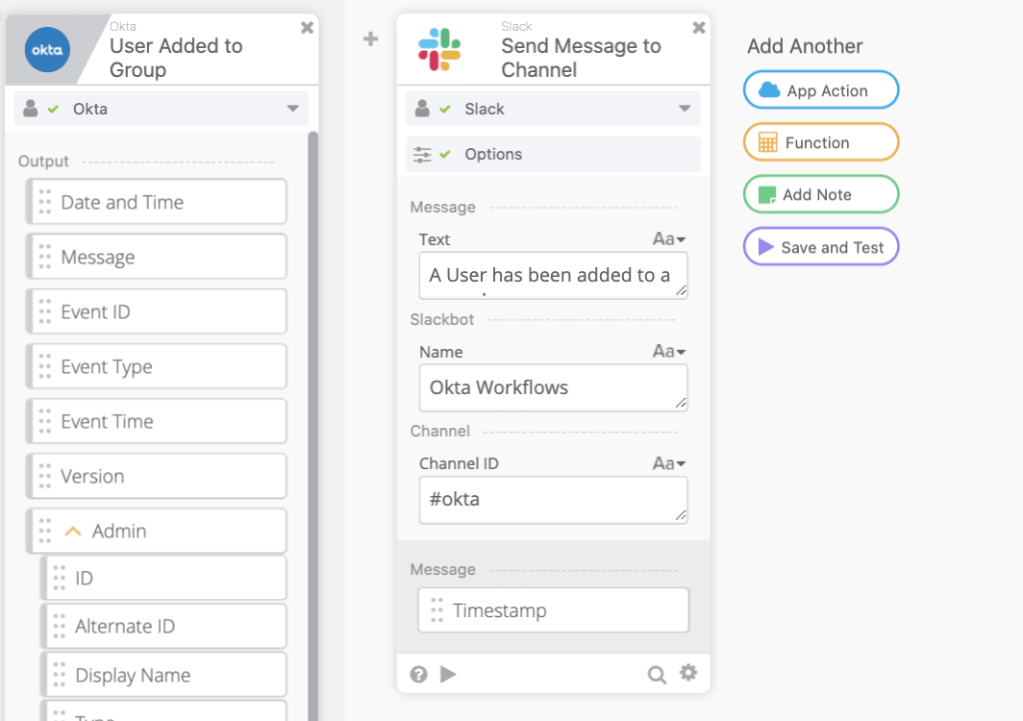
For my first workflow I’ve elected to solve a really basic use case – Sending a message to slack when a user is added to an admin group. ChatOps style interactions are becoming really popular for internal IT teams and are a lot nicer than automated emails. Slack is supported by workflows out of the box and there is an O365 Graph API option available if your organisation is using Microsoft Teams.
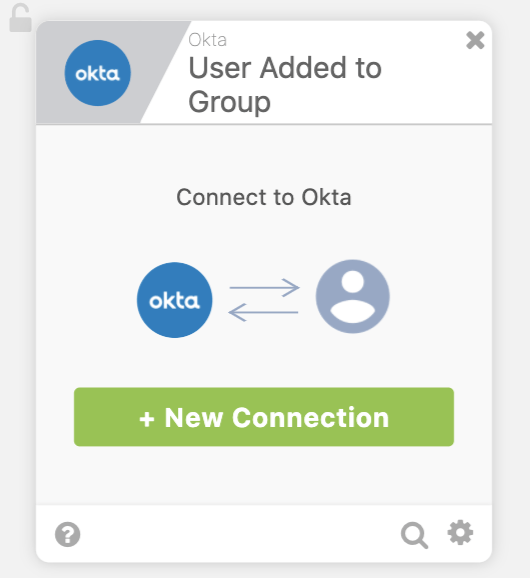
First up is a trigger; User added to a group will do the trick!
Whenever you add a new integration, you will be prompted for a new connection and depending on the service, this will be different. For Okta, this is a simple OpenID app that is added when workflows is onboarded to the org. Okta Domain, Client ID, Client Secret and we are up and running!
Next, I need to integrate with Slack – Same process; Select a task, connect to the service;
Finally, I can configure my desired output to slack. A simple message to the #okta channel will do.
Within about 5 minutes I’ve produced a really simple two step flow, and I can click save & test on the right!
Looking Good!
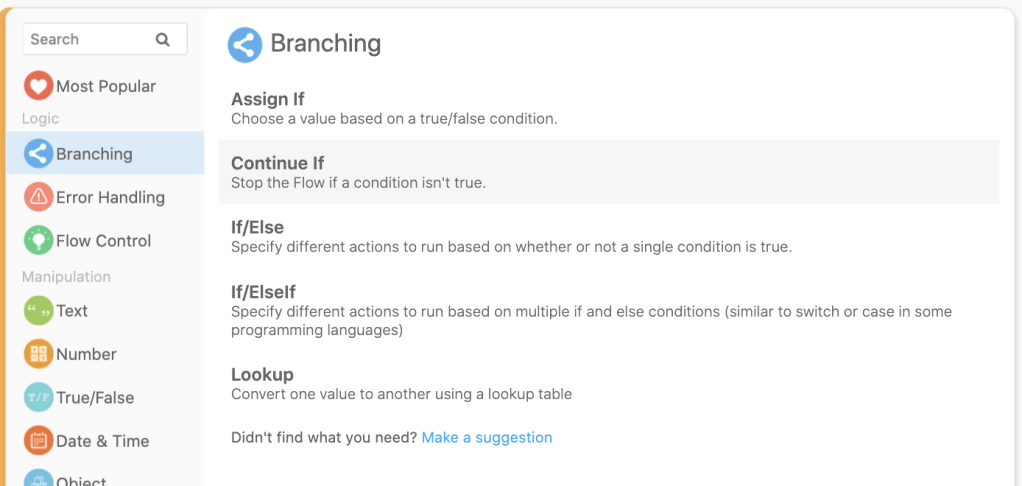
If you’ve been paying attention, you would have realised that this flow is pretty noisy – I would have a message like this for ALL okta groups. How about adding conditions to this flow for only my desired admin group?
Under the “Functions” option, I can elect to add a simple Continue If condition and drag across the group name for my trigger. Group ID would definitely be a bit more implicit, but this is just a demo 💁🏻.
Finally, I want to clean up my slack message & provide a bit more information. A quick scroll through the available functions and I’m presented with a text concatenate;
Save & Test – Looking Good!
Whats Next?
My first impressions of the Okta Workflows service are really positive – The UI is definitely well designed & accessible to the majority of employees. I really like the left to right flow, the functionality & the options available to me in the control pane.
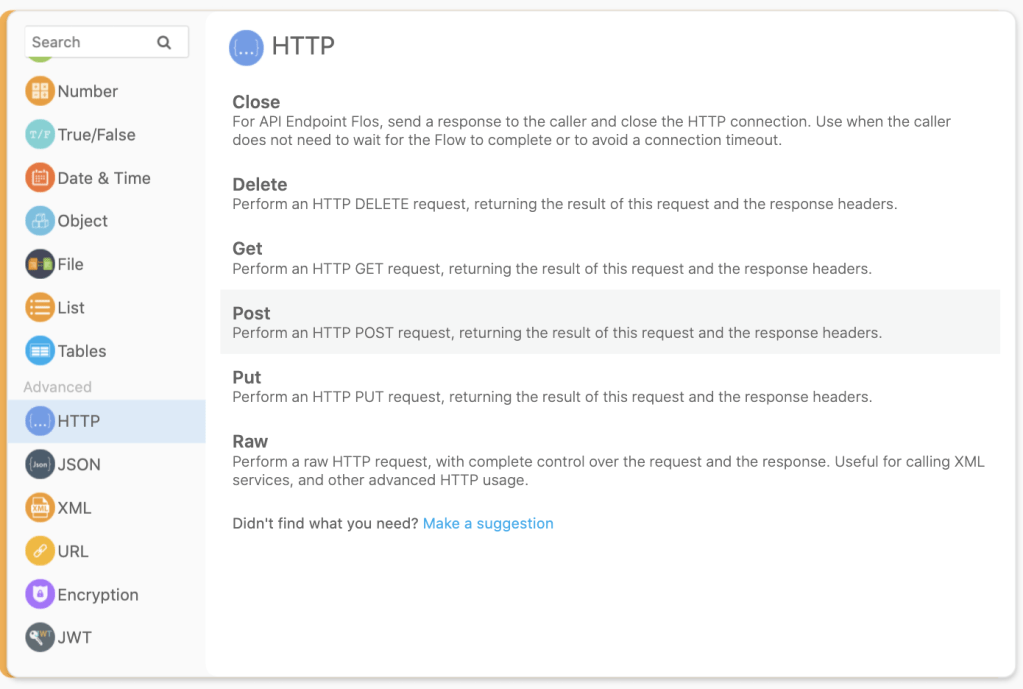
The early support for key services is great. Don’t worry if something isn’t immediately available as an Okta deployed integration – If something has an API you can consume it with some of the advanced functions.
REST API Integration
If you want to dive straight into the Workflows deep end, have a look at the documentation page – Okta has already provided a wealth of knowledge. This Oktane video is also really great.
Okta Workflows only gets better from here. I’m especially excited to see the integrations with other cloud providers and have already started planning out my advanced flows! Until then, Happy tinkering!
One of the many things I love about the cloud is the ease at which it allows me to develop and deploy solutions. I recently got married – An event which is both immensely fulfilling and incredibly stressful to organise. Being a digital first millennial couple, my partner and I wanted to deliver our invites electronically. Being the stubborn technologist that I am, I used the wedding as an excuse to practice my cloud & python skills! This blog neatly summarises what I implemented, and the fun I dealt with along the way.
The Plan – How do I want to do this?
For me, the main goal moving was to deliver a simple, easy to use solution which enabled me to keep sharp on some cloud technology, time and complexity was not a deciding factor. Being a consultant, I generally touch a multitude of different services/providers and I need to keep challenged to stay up to date on a broad range of things.
For my partner, it was important that I could quickly deliver a website, at low cost, with personalised access codes and email capability – A fully fledged mobile app would have been the nirvana, but I’m not that great at writing code (yet) – Sorry hun, maybe at a future vow renewal?
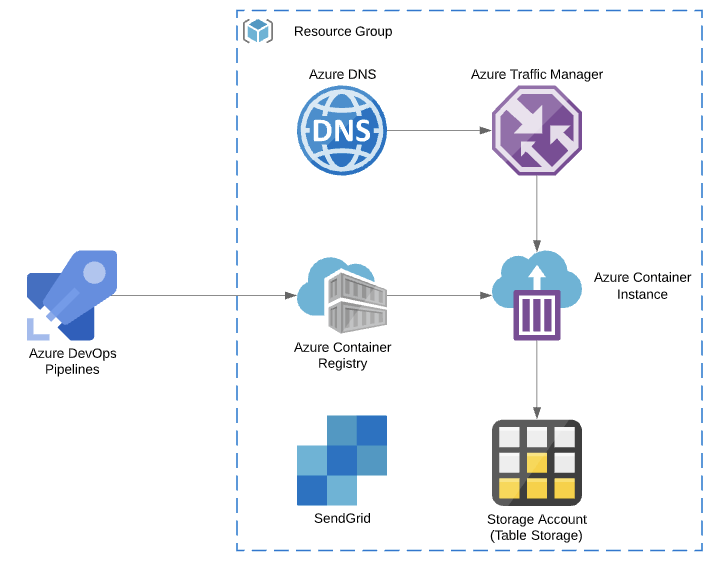
When originally planning, I really wanted to design a full end to end solution using functions & all the cool serverless features. I quickly realised that this would also take me too long to keep my partner happy, so I opted for a simpler path – an ACI deployment, with Azure Traffic manager allowing a nice custom domain (Feature request please MS). I designed Azure Storage as a simple table backend, and utilised SendGrid as the email service. Azure DNS allowed me to host all the relevant records, and I built my containers for ACR Using Azure DevOps.
Slapping together wedding invites on Azure in an afternoon? Why not?
Implementing – How to use this flask thing?
Ask anyone who knows me and they will tell you I will give just about anything a crack. I generally use python when required for scripting/automation and I really don’t use it for much beyond that. When investigating how to build a modern web app, I really liked the idea of learning some more python – It’s such a versatile language and really deserves more of my attention. I also looked at using React, WordPress & Django. However I really hate writing javascript, this blog is WordPress so no learning there, and Django was have been my next choice after flask.
Implementing into flask was actually extremely simple for basic operations. I’m certain I could have implemented my routing in a neater manner – perhaps a task for future refactoring/pull requests! I really liked the ability to test flask apps by simply running python3 app.py. A lot quicker than a full docker build process, and super useful in development mode!
The template based model that flask enables developers to utilise is extremely quick. Bootstrap concepts haven’t really changed since it was released in 2011, and modifying a single template to cater for different users was really simple.
For user access, I used a simple model where a code was utilised to access the details page, and this code was then passed through all the web requests from then on. Any code submitted that did not exist in azure storage simply fired a small error!
The end result of my bootstrap & flask configuration was really quite simple – my Fiance was quite impressed!
Deployment – Azure DevOps, ACI, ARM & Traffic Manager
Deploying to Azure Container Registry and Instances is almost 100% idiotproof within Azure DevOps. Within about five minutes in the GUI, you can get a working pipeline with a docker build & push to your Azure Container Registry, and then refresh your Azure Container Instances from there. Microsoft doesn’t really recommend using ACI for anything beyond a simple workloads, and I found support for nearly everything to be pretty limited. Because I didn’t want a fully fledged AKS cluster/host or an App Service Plan running containers, I used traffic manager to work around the custom domain limitations of ACI. As a whole, the traffic manager profile would cost me next to nothing, and I knew that I wouldn’t be receiving many queries to the services.
At some point I looked at deploying my storage account using ARM templates, however I found that table storage is currently not supported for deployment using this method. You will notice that my azure pipeline uses the Azure Shell commands to do this. I didn’t get around to automating the integration from storage to container instances – Mostly because I had asked my partner to fill out another storage account table manually and didn’t want to move anything!
For my outbound email I opted to utilise SendGrid. You can actually sign up for this service within the Azure Portal as a “third party service”. It adds an object to your resource group, however administration is still within the SendGrid portal.
Issues?
As an overall service, I found my deployment to be relatively stable. I ran two issues through my deployment, both of which were not too simple to resolve.
1. Azure Credit & Azure DNS – About halfway through the live period after sending my invites, I noticed that my service was down. This was actually due to DNS not servicing requests due to insufficient credit. A SQL server I was also labbing had killed my funds! This was actually super frustrating to fix as I had another unrelated issue with the Owner RBAC on my subscription – My subscription was locked for IAM editing due to insufficient funds, and I couldn’t add another payment method because I was not owner – Do you see the loop too? I would love to see some form of payment model that allows for upfront payment of DNS queries in blocks or chunks – Hopefully this would prevent full scale DNS based outages when using Azure DNS and Credit based payment in the future.
2. SPAM – I also had a couple of reports of emails sent from sendgrid being marked as spam. This was really frustrating, however not common enough for me to dig into as a whole, especially considering I was operating in the free tier. I added a DKIM & DMARC Record for my second run of emails and didn’t receive as much feedback which was good.
The Cost – Was it worth it?
All in All the solution I implemented was pretty expensive when compared to other online products and even other Azure services. I could have definitely saved money by using App Services, Azure Functions or even static Azure Storage websites. Thankfully, the goal for me wasn’t to be cheap. It was practice. Even better though, my employer provides me with an Azure Credit for dev/test, so I actually spent nothing! As such, I really think this exercise was 100% worth it.
Summary – Totally learnt some things here!
I really hoped you enjoyed this small writeup on my experience deploying small websites in Azure. I spent a grand total of about three hours over two weeks tinkering on this project, and you can see a mostly sanitised repo here. I definitely appreciated the opportunity to get a little bit better at python, and will likely look to revisit the topic again in the future!
(Heres a snippet of the big day – I’m most definitely punching above my average! 😂)
As sweat our way through the first days of 2020 (Thanks Melbourne), I think it would be good for me to write a post on the crazy 2019 I’ve had. Probably a bit obnoxious, but who cares – My blog my rules.
For me, 2019 was a huge success. I started out the year as a consultant, with no particular goals aside from presenting at some community events. I finish as a technical lead, with 5 speaking engagements, 8 certifications exams completed and quite a few blogs/webinars outings under my belt. Lets start at the top.
Speaking
I started 2019 with the knowledge that I sucked at public speaking. I wore a suit for the first six months of my consulting career because it made me feel secure when talking to three or four people. I knew I sucked at presenting and wanted to get better. At the end of the year, I really do feel that I’m getting there. That whole cliche of Practice making perfect. In order of my appearances, I presented at:
Global Integration BootCamp – Azure Service Bus
Global Azure BootCamp – Securing Azure DevOps
Melbourne PowerApps & Flow Meetup – Vulnerability Scanning with PowerApps
Azure Security Meetup – Securing Azure @ Scale, The Basics
Melbourne MultiCloud Meetup – One Cloud to Rule them All
I really enjoyed presenting at these events, especially the Global Boot Camps. I think the funniest story I got from these presentations was the Securing DevOps talk – I arrived at the event with no knowledge that I would be presenting, fully intending to spend the day learning. I yelled some jokes at the MC, at which point I was asked if I was ready to present that afternoon. Queue confused expression. I had originally put my hand up to speak, but due to a communications breakdown, I never received any confirmation. I spent the full day locked in a room scrambling to get a talk together – In the end, I cheated and talked about governance. Half the room fell asleep and I skated out with an alright presentation!
Getting Certified
What a labor of love getting certified is. Thankfully I am fully supported by my employer 🙂 . I started in March, with a goal to get Azure Certified at the Architect level. First up was AZ-100/101 and I really found the certification process an interesting one. I left the 100 exam feeling extremely underwhelmed, and absolutely died in the 101 exam. I do think that the administrator exams didn’t cover the level of detail I would expect from an actual service Administrator, but I’ve had different feedback from multiple sources. It was pretty disappointing to realize that not long after stressing through the 101, it was retired in favor of the new 103 exam! Live and learn I suppose. From the success of the Azure administrator exams, I did my best to sort my architect exams by the end of July, just scraping in before August with both exams! These were a lot more in depth than the admin pair, although there was definitely a couple of “vendor speak” questions. These are easily the most frustrating types of questions for me, because often they translate into real world product selection by architects or administrators where the product isn’t best fit for a company!
After finishing those four exams I was invigorated, setting myself a goal of doing 12 in 12 months. I’m currently 8 in, having also passed two AWS certifications, Azure Security & Okta Professional! Easily the most difficult exam within these was the Okta Pro; Firstly they use a ridiculous exam format designed to induce stress and anxiety – Check out DOMC for all your heart palpitation needs. Secondly, there just isn’t affordable and accessible high quality content! I love ACloudGuru and Pluralsight for this – They provide world class content for next to nothing.
I’m starting 2020 off with GCP & AWS exams in January before taking a break to get married in February. Two months from March to April to hit 12 in 12, wish me luck!
Blogging & All the Other Successes!
Blogging & Other – What a category 😀 . One of the ways which I learn concepts is through explaining them to other people. This was the primary reason I started blogging here. Once I got the hang of it, I found that I really did enjoy writing here. I’m proud to have published 10 blogs on my site (and on xello.com.au). This year I want to write focused blogs on cloud security & identity topics. If you’re reading this and you have any requests, please reach out! I also contributed to a couple of webinars, mostly work based topics. These are something I find really difficult, as it takes time to actually get a decent attendee list & the shorter time frames are quite difficult. I think the success I am most happy about is to have got Multi Cloud Melbourne off the ground! Community events are honestly the best way to dip your toe into a topic, and the community in Melbourne is actually insane! If you’re not signed up to attend an event, head on over to meetup.com and register now – Seriously it’s great.
I was also extremely blessed to be made a technical lead @ Xello this year. This role has been really fun, and I’ve loved getting involved with more customer work & technical challenges.
Thankyou
Most importantly, I wouldn’t be writing this post without a cadre of people who support me, both professionally and personally. A big thank you to all of these people, they all know who they are. Another big thank you goes out to you – my network. Thank you for engaging with me, on whatever medium you choose. Its always a pleasure to meet another person who is cloud obsessed. Here’s to a brilliant 2020, may all your plans come to fruition!!
In one of my favourite movies Gerard Butler utters the line “lessons not learned in blood are soon forgotten”. That is certainly how I felt last week while attempting to regain access to my cloud accounts. Ok, Ok – Maybe a movie about a jail-bound revenge obsessed serial killer isn’t the best analogy for a nerd playing god in a cloud lab.
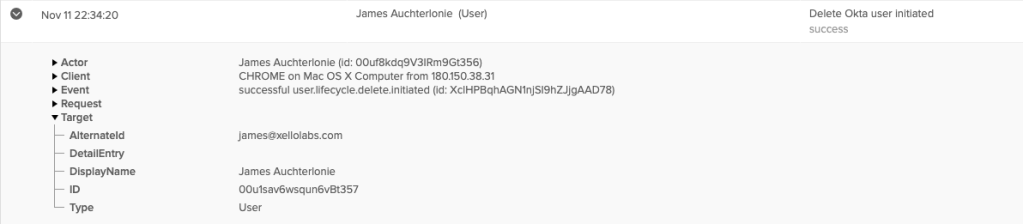
Whenever playing with a cloud service that manages provisioning & activations for your cloud users, it’s important to be alert and understand what actions you are taking. How was I reminded of this? I broke my own setup! While deleting a bunch of users in a fit of rage at an inconvenient Lab setup last week, I was neither alert, nor understanding. Have a look at the below screenshots and have a guess at what happened.
The importance of this account? It was my Google Cloud Super admin.
Here is the part where you say – It’s alright James, use your emergency account. Your rainy day account. The forgot my password account. The one you keep spare for when you get hit by a bus.
Bummer for me – I didn’t configure one.
Ok, fair enough, There’s an account recovery process right? The problem? Account recovery doesn’t work for a disabled account.
Next. Maybe I can re-enable the account using Okta? Remember that fit of rage I was talking about? I also deleted the Okta Application.
Yep. I’m a bonehead.
Ok, next option? Google support. Surely they should be able to help me!
Case: #21249639
Subject: Okta Deleted/Disabled my organisation Super Administrator

Evening Google,

I was testing some Okta configuration for google cloud configuration late at night. Unfortunately I deleted an okta account that matched the GCP account, and it disabled/deleted the corresponding account: james@xellolabs.com which is the super administrator for my GCP test organisation. I am no longer able to log into the google cloud console or admin.google.com to configure IAM or any extra users.

I can provide proof of ownership for the DNS zone xellolabs.com

I can also provide information as to how the organisation is configured, likely how it is billed (Can't remember the exact credit card)

Apologies for this boneheaded error, I will setup an emergency account in future.

Cheers,

James
You can see where this is going right? Google Response 1 (Paraphrased for length)
Dear James,
That certainly is boneheaded of you. Please refer to our support article here for admin password reset. https://support.google.com/a/answer/33561?hl=en

Thanks

Google Support.
No thank-you google – I need some actual help here.
Morning Google,

Unfortunately this does not solve my problem. As I mentioned in the original ticket, Okta has disabled the Super Administrator for my google organisation. I cannot log in to admin.google.com to create new accounts or modify users. I can also not recover the account as it is disabled.

When I log into the google console, I receive the following username:

fe0b6545633f422e8501f62c8d3ca20aJames@xellolabs.com

I believe it should be just james@xellolabs.com

If you could assist with activating the account I can log in, as I definitely have working credentials

Cheers,

James
Google Response 2 (Paraphrased for length)
Dear James,

I understand you have a problem. It looks like you are having an account ownership dispute. Unfortunately google cannot adjudicate these disputes, please reach out to the  super admin for access. Should you like, I can contact the super admin and ask them to contact you.
If none of this works, we can completely delete your organisation and you build your lab again.

Thanks,

Google Support.
FFS Guys! It’s me! I swear! At this point I requested that google contact my super admin. After all, this lab had a population of 3. Me, Myself and I. Surely they would flick a message to one of my many emails?
Outlook? Gmail? Work? Hotmail? Custom Email?
Zilch. Nada. Nothing. All in all a frustrating experience with Google support. Not something I would recommend on the best of days.
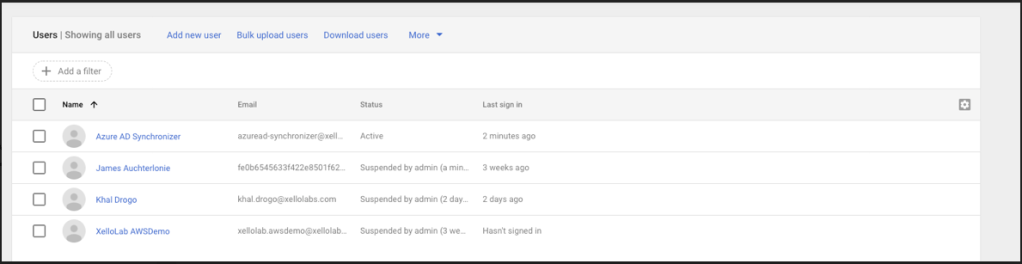
Finally I realised that I had configured a service account for Azure-> GCP integration. I had credentials for this thankfully. I could check who was in my google org & who I was supposed to be contacting!
One quick login to admin.google.com:
Even better news? This was the account I needed! In a past life I had been a lazy bastard and not configured the minimum RBAC!
Account Recovered!
Ok so what did we learn today?
Configure a break glass account. Store it offline & test it regularly.
Don’t rely on support to recover your account. Contextual information like a service account names will be overlooked & you may get the runaround.
Don’t add your break glass accounts to automated deprovisioning flows. You are asking for trouble.
Document the level of access you grant to service accounts. You never know when this information might come in handy!
Have a tested BCDR strategy, using off cloud backup or IaC to restore.
Most importantly, I learnt my lesson in blood. Don’t be a bonehead and hopefully you won’t run into this problem yourself!
More often then not, companies begin a modern identity journey by expanding the capability of an existing identity store. This could be federation using ADFS, identity governance using SailPoint, or integration to a third party directory.
Active Directory (AD) is a highly extensible and capable solution for the majority of legacy business cases and is easily the most common identity store in the industry. With the advent of cloud, however, the on-premise directory is starting to show its age – and that’s why my favourite initial capability addition is to integrate Okta.
In this technical blog, I’ll take you through the basics, and demonstrate some Universal Directory capability.
Integrating Okta with AD: An Introduction
Before we get started, it’s valuable to address the three most common questions most people will ask when I begin the conversation about using Okta with Active Directory:
1. Why choose a cloud directory?
The cloud directory conversation boils down to one point: Less infrastructure. I’ll probably need a bit of infrastructure to run the initial phase of any identity uplift, but lets be honest; Infrastructure is hard work, We don’t want it and we certainly don’t want to plan our transformation with the idea of working harder in mind.
2. Why a third party directory?
The second question isn’t a dig at any one provider, but providers generally operate with their own services in mind. Sure, you can plug external solutions into a proprietary solution, but the integration to the vendor ecosystem products is always a little bit better. A third party directory really removes this problem, as they are focused on offering businesses well-managed, easy identity and access management (IAM).
3. Why Okta?
Okta is the world’s leading Identity as a Service (IDaaS) solution for both enterprise and small and midsize businesses, with some incredible versatility owing to its cloud-based delivery model. For a deeper comparison on some of the Gartner market leaders in the modern identity space, head on over to our comparison of Ping & Okta.
How to connect AD to Okta
So you’ve decided to connect AD to Okta. Great! Now is the time to understand the requirements for your Okta connectors and your AD integration scenario before deployment – generally two member servers will work for a HA deployment. Greater than 30,000 users? You probably should have a few more!
As an optional first step, we can create a service account and assign the relevant permissions for provisioning.
By default, the AD Agent installer will create “OktaService”, but you need to make updates for provisioning and group push. I’ve got quick little script to create the required account with the minimum requirements for both.
This file contains hidden or bidirectional Unicode text that may be interpreted or compiled differently than what appears below. To review, open the file in an editor that reveals hidden Unicode characters.
Learn more about bidirectional Unicode characters
You will notice the account gets write on a specific set of attributes within the OU – this is by design as you should only ever assign access to the minimum required attributes. If you intend on adding extra attributes to Universal Directory, you will need to configure the service account access to each attribute in a similar fashion.
For my lab, I’ve taken a short-cut and provided the account to full attribute write.
Next, we can log into our Okta portal and download the AD agent. Run the installer on a separate server to your domain controller, as you should always strive to separate out services between servers.
The agent installer is fairly straight forward, and the process can be initiated from the web portal. (Directory Integrations > Add Directory > Active Directory.) The key steps are as follows:
Specify the service account: In our case, this will be custom account.
Provide your subdomain and log in to Okta: This step will allow the agent to register.
Select the essentials: The OU’s you would like to run sync from + attributes to be included in your profiles.
You should finish step 3 with the following prompt. If you get stuck, there is detailed instructions in the Okta documentation.
Disable Active Directory Profile Mastering: For the purpose of this blog, I’m going to disable AD Profile Mastering. This ensures that Okta remains as the authoritative source for my user profiles. You can find this option under the import and provisioning settings of the directory.
Enabling Okta to provision AD Accounts
Now we have completed a base setup, most administrators will configure up user matching and synchronisation (Step 2 in the official Okta provided documentation).
I’m lucky enough to have a brand new AD domain, that I would like to push Okta users to, allowing me to skip straight to Okta Mastered AD Accounts – winning!
Okta mastered accounts rely on the concept of Universal Directory. The UD is an excellent Okta feature that enables administrators to pivot data from Okta into and out of third party services. Universal Directory enables HR as a master scenarios, and data flow between the vast majority of Okta applications. For a detailed overview on UD, have a look at this excellent page from Okta’s official documentation.
Enabling Okta provisioning in AD: First I need to navigate to my directory settings and enable “Create Users”. To ensure my user data always stays accurate, I’ll also be enabling “Update User attributes”.
Create an Okta Group: Self-explanatory! Click Add Group and fill out the details as desired.
Assign a directory to the Okta Group: This ensures users who are added to the Okta Group are automatically written down into the AD OU. To do this, navigate to the group, and select Manage Directories.
Add your AD domain to the “Member Domain” section: You are able to select multiple AD domains here, which is extremely useful for Multi Domain scenarios. You can also use UD to daisy chain together AD domains, enabling a migration scenario. Select Next and configure your target OU. This should match the OU you specified in the earlier service account setup, as the service does need permission to create your AD account.
Assign users to AD: Everything is now set up! The assignment process is pretty simple – navigate to the group, manage users and move across your targeted user. Select save to initiate the Okta provisioning action.
A quick look in AD, and my account has already been provisioned! This process is extremely quick, with the account remaining disabled initially. This is a by-default security feature.
How to setup Okta and Active Directory Integration & Provisioning: Next steps
We hope our walkthrough of Okta and Active Directory Integration & Provisioning has given you the 10,000 foot overview on what is possible with Okta to AD integration – and you’re able to see the unique value and potential business case within your company.
There is a broad range of integration options, processes and nitty gritty application settings and while the barrier to initial entry quite easy, a detailed setup can get complex quickly. As always, please feel free to reach out to myself or the team if you enjoyed this article or have any questions!